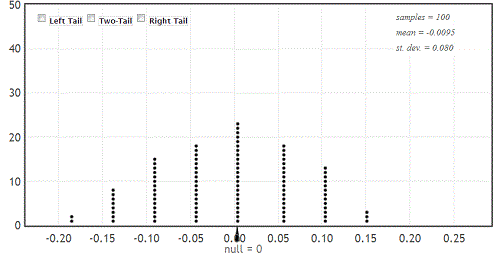
Left Tail Right Tail sampler = 100 Two-Tail mean = -0.0095 40 st. dev =0.050 30 20 10 0.00 null = 0 -0.20 -0.15 -0.10 -0.05 0.05 0.10 0.15 0.20 0.25 ......


- Suppose you are investigating whether the proportion of milk chocolate M&M's that are green differs from the proportion of dark chocolate M&M's that are green. You purchase a bag of each variety, and summarize your data in the following table.
|
|
Green |
Not Green |
Total |
|
|
Milk Chocolate |
8 |
33 |
41 |
|
|
Dark Chocolate |
4 |
38 |
42 |
|
|
Total |
12 |
71 |
83 |
|
(a) Define the appropriate parameter(s) and state the null and alternative hypotheses for testing if the proportion of green M&M's differs for milk chocolate and dark chocolate M&M's.
(b) Find the sample proportion of milk chocolate M&M’s that are green and the sample proportion of dark chocolate M&M’s that are green. Then find their difference.
(c) If you were to use the following randomization distribution (based on 100 samples) to compute the p-value, what would it be?
p-value = ____________
(d) If you were to use a 5% significance level (i.e., α = 0.05), what would be your formal conclusion?
(e) Tell whether this sample provides evidence that the proportion of candies that are green differs for the two types of M&M's. Include an assessment of the strength of your evidence (i.e., little, some, moderate, strong, or very strong).


Trending now
This is a popular solution!

Step by step
Solved in 5 steps with 8 images


