To test if there is a difference in the population variances, the appropriate degrees of freedom (in the correct order) for the critical value are...
To test if there is a difference in the population variances, the appropriate degrees of freedom (in the correct order) for the critical value are...

MATLAB: An Introduction with Applications
6th Edition
ISBN:9781119256830
Author:Amos Gilat
Publisher:Amos Gilat
Chapter1: Starting With Matlab
Section: Chapter Questions
Problem 1P

Related questions
Question
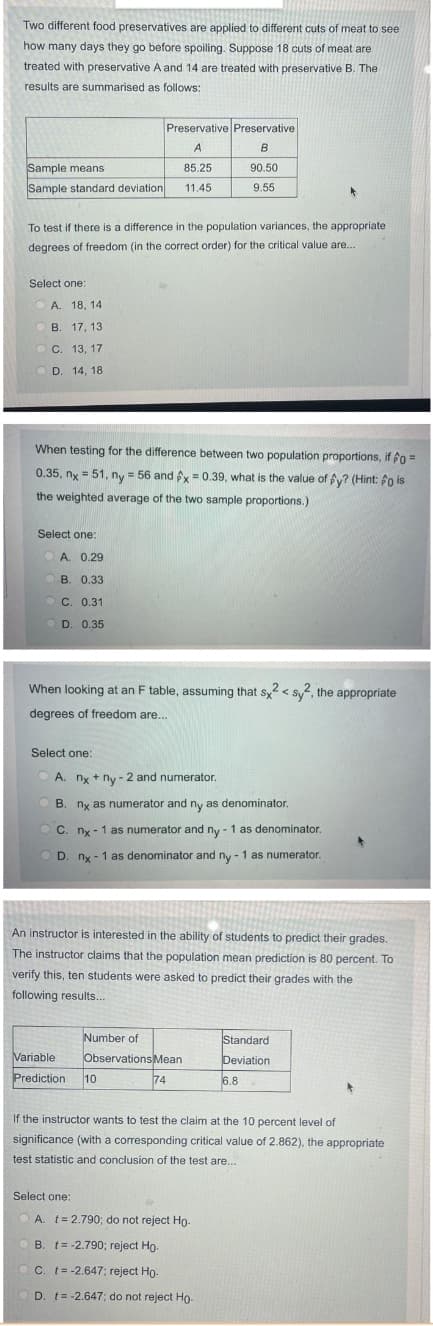
Transcribed Image Text:Two different food preservatives are applied to different cuts of meat to see
how many days they go before spoiling. Suppose 18 cuts of meat are
treated with preservative A and 14 are treated with preservative B. The
results are summarised as follows:
Preservative Preservative
A
B
Sample means
85.25
90.50
Sample standard deviation
11.45
9.55
To test if there is a difference in the population variances, the appropriate
degrees of freedom (in the correct order) for the critical value are..
Select one:
O A. 18, 14
В. 17, 13
ОС. 13, 17
D. 14, 18
When testing for the difference between two population proportions, if fo =
0.35, ny = 51, ny = 56 and fy= 0.39, what is the value of fy? (Hint: fo is
the weighted average of the two sample proportions.)
Select one:
A. 0.29
В. 0.33
C. 0.31
D. 0.35
When looking at an F table, assuming that sy < sy, the appropriate
degrees of freedom are..
Select one:
O A. ny + ny - 2 and numerator.
B. nx as numerator and ny as denominator.
O C. nx - 1 as numerator and ny - 1 as denominator.
O D. nx - 1 as denominator and ny - 1 as numerator.
An instructor is interested in the ability of students to predict their grades.
The instructor claims that the population mean prediction is 80 percent. To
verify this, ten students were asked to predict their grades with the
following results...
Number of
Standard
Variable
Observations Mean
Deviation
Prediction
10
74
6.8
If the instructor wants to test the claim at the 10 percent level of
significance (with a corresponding critical value of 2.862), the appropriate
test statistic and conclusion of the test are...
Select one:
A. t= 2.790; do not reject Ho-
B. t= -2.790; reject Ho.
O C. t= -2.647; reject Ho-
OD. t= -2.647; do not reject Ho.
Expert Solution
This question has been solved!
Explore an expertly crafted, step-by-step solution for a thorough understanding of key concepts.

Step by step
Solved in 2 steps

Recommended textbooks for you
MATLAB: An Introduction with Applications
Statistics
ISBN:
9781119256830
Author:
Amos Gilat
Publisher:
John Wiley & Sons Inc

Probability and Statistics for Engineering and th…
Statistics
ISBN:
9781305251809
Author:
Jay L. Devore
Publisher:
Cengage Learning

Statistics for The Behavioral Sciences (MindTap C…
Statistics
ISBN:
9781305504912
Author:
Frederick J Gravetter, Larry B. Wallnau
Publisher:
Cengage Learning
MATLAB: An Introduction with Applications
Statistics
ISBN:
9781119256830
Author:
Amos Gilat
Publisher:
John Wiley & Sons Inc
Probability and Statistics for Engineering and th…
Statistics
ISBN:
9781305251809
Author:
Jay L. Devore
Publisher:
Cengage Learning
Statistics for The Behavioral Sciences (MindTap C…
Statistics
ISBN:
9781305504912
Author:
Frederick J Gravetter, Larry B. Wallnau
Publisher:
Cengage Learning

Elementary Statistics: Picturing the World (7th E…
Statistics
ISBN:
9780134683416
Author:
Ron Larson, Betsy Farber
Publisher:
PEARSON

The Basic Practice of Statistics
Statistics
ISBN:
9781319042578
Author:
David S. Moore, William I. Notz, Michael A. Fligner
Publisher:
W. H. Freeman

Introduction to the Practice of Statistics
Statistics
ISBN:
9781319013387
Author:
David S. Moore, George P. McCabe, Bruce A. Craig
Publisher:
W. H. Freeman