To test the durability of the material used for running shoes, a sample is placed in testing device that simulates an average-sized person using the shoes until the material wears out. The material is supposed to last at least an average of 20 months. Suppose that the wear-out time is characterized by a normal distribution with both μ and σ unknown. A test on five randomly selected pairs of shoes yields wear-out times of 20, 28, 18, 24, and 25 months. Wanting to be fairly certain that the material will exceed the average wear of 20 months, formulate and test the appropriate hypothesis (with α = 0.05) that the shoes have the required mean durability. Identify the rejection region.


To test the durability of the material used for running shoes, a sample is placed in testing device that simulates an average-sized person using the shoes until the material wears out. The material is supposed to last at least an average of 20 months. Suppose that the wear-out time is characterized by a
A test on five randomly selected pairs of shoes yields wear-out times of 20, 28, 18, 24, and 25 months.
Wanting to be fairly certain that the material will exceed the average wear of 20 months, formulate and test the appropriate hypothesis (with α = 0.05) that the shoes have the required mean durability. Identify the rejection region.
Let denotes the average sized person using the shoes until the material wears out. The hypothesis is,
Null hypothesis:
Alternative hypothesis:
The descriptive analysis is conducted using EXCEL. The software procedure is given below:
- Enter the data.
- Select Data > Data Analysis >Descriptive Statistics> OK.
- Enter Input Range as Times column.
- Mark Labels in First Row.
- Mark Summary Statistics.
- Click OK.
The output using EXCEL is as follows:
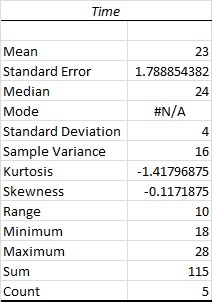
From the output, the mean is 23, and the standard deviation is 4.
The test statistic is,
The test statistic is 1.677.

Trending now
This is a popular solution!

Step by step
Solved in 2 steps with 1 images


