to worker, and the company decides to eliminate this effect by selecting 8 workers at random and timing each worker on each assembly process. Half of the workers are chosen at random to use Process 1 first, and the rest use Process 2 first. For each worker and each process, the assembly time (in minutes) is recorded, as shown in the table below. Worker Process 1 Process 2 Difference (Process 1 - Process 2) Send data to calculator 1 66 Explanation 24 Check 42 2 40 32 8 3 73 59 14 4 87 51 36 5 86 41. 69 17 6 (a) State the null hypothesis H, and the alternative hypothesis H₁. HO 31 10 7 50 14 36 8 35 Based on these data, can the company conclude, at the 0.05 level of significance, that the mean assembly times for the two processes differ? Answer this question by performing a hypothesis test regarding H. (which is u with a letter "d" subscript), the population mean difference in assembly times for the two processes. Assume that this population of differences (Process 1 minus Process 2) is normally distributed. 22 Perform a two-tailed test. Then complete the parts below. Carry your intermediate computations to three or more decimal places and round your answers as specified. (If necessary, consult a list of formulas.) 13 H Y O A
to worker, and the company decides to eliminate this effect by selecting 8 workers at random and timing each worker on each assembly process. Half of the workers are chosen at random to use Process 1 first, and the rest use Process 2 first. For each worker and each process, the assembly time (in minutes) is recorded, as shown in the table below. Worker Process 1 Process 2 Difference (Process 1 - Process 2) Send data to calculator 1 66 Explanation 24 Check 42 2 40 32 8 3 73 59 14 4 87 51 36 5 86 41. 69 17 6 (a) State the null hypothesis H, and the alternative hypothesis H₁. HO 31 10 7 50 14 36 8 35 Based on these data, can the company conclude, at the 0.05 level of significance, that the mean assembly times for the two processes differ? Answer this question by performing a hypothesis test regarding H. (which is u with a letter "d" subscript), the population mean difference in assembly times for the two processes. Assume that this population of differences (Process 1 minus Process 2) is normally distributed. 22 Perform a two-tailed test. Then complete the parts below. Carry your intermediate computations to three or more decimal places and round your answers as specified. (If necessary, consult a list of formulas.) 13 H Y O A

Holt Mcdougal Larson Pre-algebra: Student Edition 2012
1st Edition
ISBN:9780547587776
Author:HOLT MCDOUGAL
Publisher:HOLT MCDOUGAL
Chapter11: Data Analysis And Probability
Section: Chapter Questions
Problem 8CR

Related questions
Question

Transcribed Image Text:A computer manufacturer is interested in comparing assembly times for two keyboard assembly processes. Assembly times can vary considerably from worker
to worker, and the company decides to eliminate this effect by selecting 8 workers at random and timing each worker on each assembly process. Half of the
workers are chosen at random to use Process 1 first, and the rest use Process 2 first. For each worker and each process, the assembly time (in minutes) is
recorded, as shown in the table below.
Worker
Process 1
Process 2
Difference
(Process 1 - Process 2)
Send data to calculator V
1
66
Explanation
24
Check
42
2
40
32
co
3
73
59
14
4
87
51
36
5
86
69
O
17
(a) State the null hypothesis H, and the alternative hypothesis H₁.
Ho
6
41.
31
10
7
31
50 35
14
Based on these data, can the company conclude, at the 0.05 level of significance, that the mean assembly times for the two processes differ? Answer this
question by performing a hypothesis test regarding H (which is u with a letter "d" subscript), the population mean difference in assembly times for the two
processes. Assume that this population of differences (Process 1 minus Process 2) is normally distributed.
8
36
Perform a o-ta test. Then complete the parts below. Carry your intermediate computations to three or more decimal places and round your answers as
specified. (If necessary, consult a list of formulas.)
22
13
μ
Y
O
S
Р
A
Ⓒ2022 McGraw Hill LLC. All Rights Reserved. Terms of Use Privacy Center Accessil
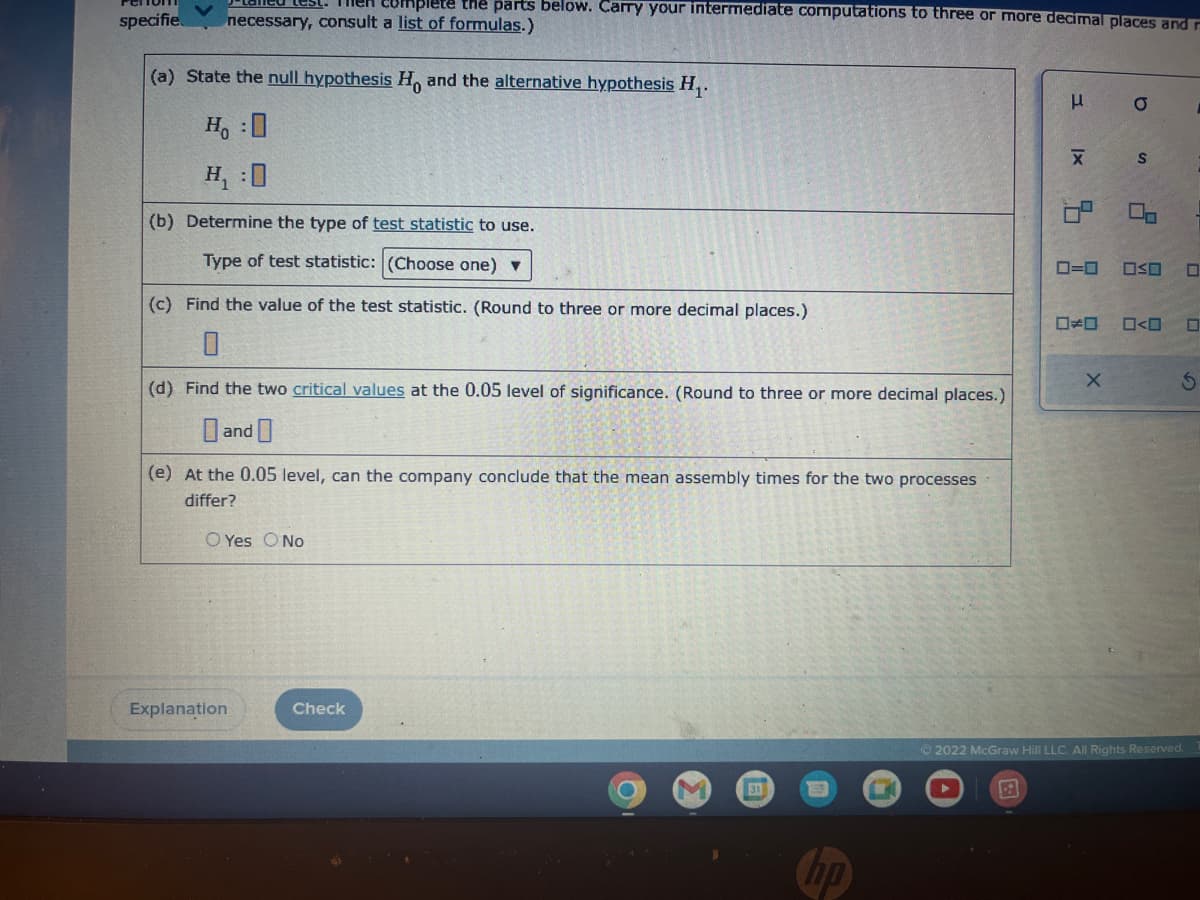
Transcribed Image Text:plete the parts below. Carry your intermediate computations to three or more decimal places and r
specifie necessary, consult a list of formulas.)
(a) State the null hypothesis Ho and the alternative hypothesis H₁.
Ho
H₁ :0
(b) Determine the type of test statistic to use.
Type of test statistic: (Choose one) ▼
(c) Find the value of the test statistic. (Round to three or more decimal places.)
0
(d) Find the two critical values at the 0.05 level of significance. (Round to three or more decimal places.)
and
d0
(e) At the 0.05 level, can the company conclude that the mean assembly times for the two processes
differ?
O Yes O No
Explanation
Check
311
hp
L
|x
X
9.
0=0
ロメロ
X
a
S
On
OSO
0<0
0
Ⓒ2022 McGraw Hill LLC. All Rights Reserved.
0
S
Expert Solution
This question has been solved!
Explore an expertly crafted, step-by-step solution for a thorough understanding of key concepts.

Step by step
Solved in 6 steps with 4 images

Recommended textbooks for you
Holt Mcdougal Larson Pre-algebra: Student Edition…
Algebra
ISBN:
9780547587776
Author:
HOLT MCDOUGAL
Publisher:
HOLT MCDOUGAL

Algebra & Trigonometry with Analytic Geometry
Algebra
ISBN:
9781133382119
Author:
Swokowski
Publisher:
Cengage
Holt Mcdougal Larson Pre-algebra: Student Edition…
Algebra
ISBN:
9780547587776
Author:
HOLT MCDOUGAL
Publisher:
HOLT MCDOUGAL
Algebra & Trigonometry with Analytic Geometry
Algebra
ISBN:
9781133382119
Author:
Swokowski
Publisher:
Cengage