Total 10 1416266003 Hi, sahim Get a 7-day free trial to premium PDF tools. Start free trial The model is significant. Intercept YearCode Coefficients Standard Error -2062 2884.50 Stat P-value 3276.5 487.57 6.72 0.4928 8.65E-05 Sales -2,062 + 3,276.5 YearCode Intercept: The expected sales in YearCode 0 or Year 2013. YearCode: Annual sales growth of Diesel cars was 3,276.5. b) Using your regression model in part a) forecast sales for 2024, 2025, 2026. -2,062 + 3,276.5 (11) = 33,980 ALL TOOLS 2040 Sales 2025 Sales -2,062 + 3,276.5 (12) = 37,256 2026 Sales -2,062+ 3,276.5 (13) = 40,533 Export a PDF Edit text & images Convert to PDF Fill & Sign Organize pages Request e-signatures > Compress a PDF Combine files Protect a PDF c) Construct a plot that shows the observed sales for 2009-2019 and the fit line. Would you use the model to make forecasts for future years? The model doesn't appear to provide a good fit to the data. The model is under predicting sales and doesn't have enough slope the last couple years. I would not use this model for making predictions. 40000 35000 30000 25000 20000 15000 10000 5000 2012 2014 2016 2018 2020 2024 2026 2028 Sales -Forecast Page: 1 of 4 73°F Sunny Q Search QMM2410 W24 Chp 17 HW problems Ο Solution 品起 1 4 << > Q ENG 12:40 PM 4/14/2024 PRE Styles Sensitivity Add-ins F15 × ✓ fx A B C D E F G H | J K 1 2013 2800 2 2014 3577 3 2015 3139 4 2016 8469 5 2017 7331 6 2018 10972 7 2019 13573 8 2020 22634 9 2021 15077 10 2022 31430 11 2023 38524 12 13 14 15 16 17 18 19 20 21 22 23 24 25 26 27 28
Total 10 1416266003 Hi, sahim Get a 7-day free trial to premium PDF tools. Start free trial The model is significant. Intercept YearCode Coefficients Standard Error -2062 2884.50 Stat P-value 3276.5 487.57 6.72 0.4928 8.65E-05 Sales -2,062 + 3,276.5 YearCode Intercept: The expected sales in YearCode 0 or Year 2013. YearCode: Annual sales growth of Diesel cars was 3,276.5. b) Using your regression model in part a) forecast sales for 2024, 2025, 2026. -2,062 + 3,276.5 (11) = 33,980 ALL TOOLS 2040 Sales 2025 Sales -2,062 + 3,276.5 (12) = 37,256 2026 Sales -2,062+ 3,276.5 (13) = 40,533 Export a PDF Edit text & images Convert to PDF Fill & Sign Organize pages Request e-signatures > Compress a PDF Combine files Protect a PDF c) Construct a plot that shows the observed sales for 2009-2019 and the fit line. Would you use the model to make forecasts for future years? The model doesn't appear to provide a good fit to the data. The model is under predicting sales and doesn't have enough slope the last couple years. I would not use this model for making predictions. 40000 35000 30000 25000 20000 15000 10000 5000 2012 2014 2016 2018 2020 2024 2026 2028 Sales -Forecast Page: 1 of 4 73°F Sunny Q Search QMM2410 W24 Chp 17 HW problems Ο Solution 品起 1 4 << > Q ENG 12:40 PM 4/14/2024 PRE Styles Sensitivity Add-ins F15 × ✓ fx A B C D E F G H | J K 1 2013 2800 2 2014 3577 3 2015 3139 4 2016 8469 5 2017 7331 6 2018 10972 7 2019 13573 8 2020 22634 9 2021 15077 10 2022 31430 11 2023 38524 12 13 14 15 16 17 18 19 20 21 22 23 24 25 26 27 28

MATLAB: An Introduction with Applications
6th Edition
ISBN:9781119256830
Author:Amos Gilat
Publisher:Amos Gilat
Chapter1: Starting With Matlab
Section: Chapter Questions
Problem 1P
Question
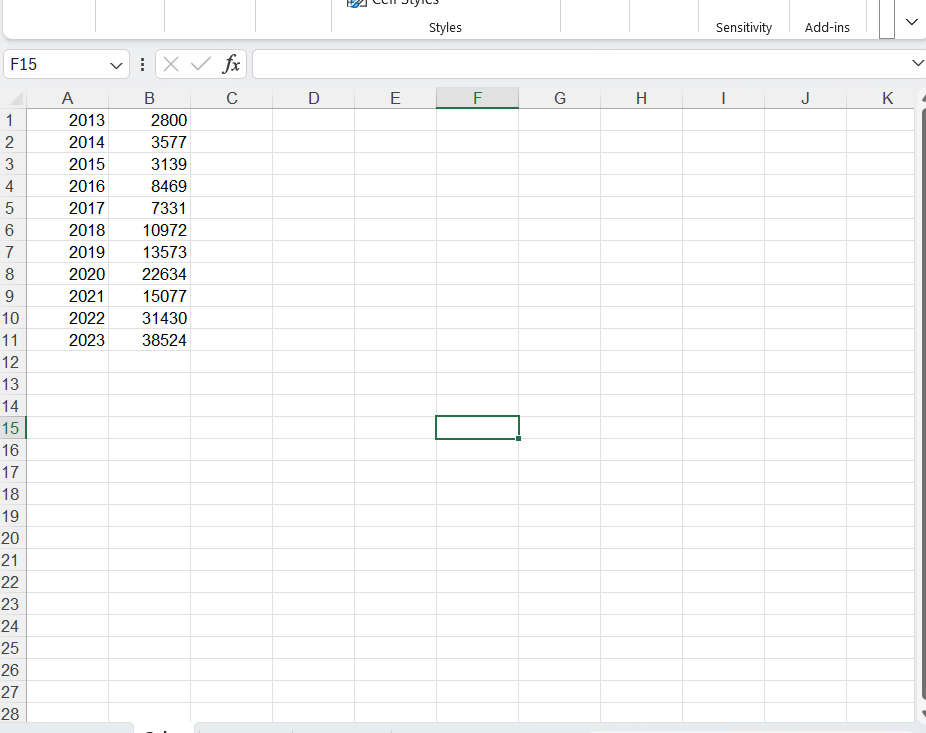
can anyone please explain the solution in part (B)? why does he multiply 2024 sales by (11), 2025 by (12), and 2025 by (13)? why he used 11,12,13 specifically to perform the forcasting for each year? I provided the data that were used in the question in case you need it
Transcribed Image Text:Total
10
1416266003
Hi, sahim
Get a 7-day free trial to premium PDF
tools.
Start free trial
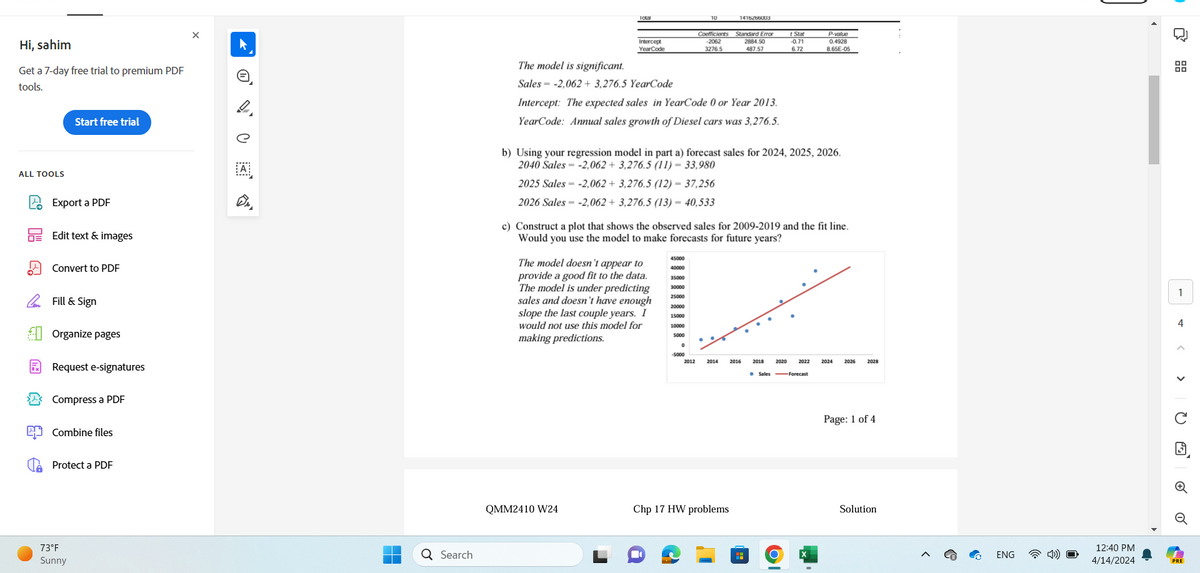
The model is significant.
Intercept
YearCode
Coefficients Standard Error
-2062
2884.50
Stat
P-value
3276.5
487.57
6.72
0.4928
8.65E-05
Sales -2,062 + 3,276.5 YearCode
Intercept: The expected sales in YearCode 0 or Year 2013.
YearCode: Annual sales growth of Diesel cars was 3,276.5.
b) Using your regression model in part a) forecast sales for 2024, 2025, 2026.
-2,062 + 3,276.5 (11) = 33,980
ALL TOOLS
2040 Sales
2025 Sales
-2,062 + 3,276.5 (12) = 37,256
2026 Sales
-2,062+ 3,276.5 (13) = 40,533
Export a PDF
Edit text & images
Convert to PDF
Fill & Sign
Organize pages
Request e-signatures
> Compress a PDF
Combine files
Protect a PDF
c) Construct a plot that shows the observed sales for 2009-2019 and the fit line.
Would you use the model to make forecasts for future years?
The model doesn't appear to
provide a good fit to the data.
The model is under predicting
sales and doesn't have enough
slope the last couple years. I
would not use this model for
making predictions.
40000
35000
30000
25000
20000
15000
10000
5000
2012
2014
2016
2018
2020
2024
2026
2028
Sales -Forecast
Page: 1 of 4
73°F
Sunny
Q Search
QMM2410 W24
Chp 17 HW problems
Ο
Solution
品起
1
4
<< >
Q
ENG
12:40 PM
4/14/2024
PRE
Transcribed Image Text:Styles
Sensitivity Add-ins
F15
× ✓ fx
A
B
C
D
E
F
G
H
|
J
K
1
2013
2800
2
2014
3577
3
2015
3139
4
2016
8469
5
2017
7331
6
2018
10972
7
2019
13573
8
2020
22634
9
2021
15077
10
2022
31430
11
2023
38524
12
13
14
15
16
17
18
19
20
21
22
23
24
25
26
27
28
Expert Solution
This question has been solved!
Explore an expertly crafted, step-by-step solution for a thorough understanding of key concepts.

Step by step
Solved in 2 steps

Recommended textbooks for you
MATLAB: An Introduction with Applications
Statistics
ISBN:
9781119256830
Author:
Amos Gilat
Publisher:
John Wiley & Sons Inc

Probability and Statistics for Engineering and th…
Statistics
ISBN:
9781305251809
Author:
Jay L. Devore
Publisher:
Cengage Learning

Statistics for The Behavioral Sciences (MindTap C…
Statistics
ISBN:
9781305504912
Author:
Frederick J Gravetter, Larry B. Wallnau
Publisher:
Cengage Learning
MATLAB: An Introduction with Applications
Statistics
ISBN:
9781119256830
Author:
Amos Gilat
Publisher:
John Wiley & Sons Inc
Probability and Statistics for Engineering and th…
Statistics
ISBN:
9781305251809
Author:
Jay L. Devore
Publisher:
Cengage Learning
Statistics for The Behavioral Sciences (MindTap C…
Statistics
ISBN:
9781305504912
Author:
Frederick J Gravetter, Larry B. Wallnau
Publisher:
Cengage Learning

Elementary Statistics: Picturing the World (7th E…
Statistics
ISBN:
9780134683416
Author:
Ron Larson, Betsy Farber
Publisher:
PEARSON

The Basic Practice of Statistics
Statistics
ISBN:
9781319042578
Author:
David S. Moore, William I. Notz, Michael A. Fligner
Publisher:
W. H. Freeman

Introduction to the Practice of Statistics
Statistics
ISBN:
9781319013387
Author:
David S. Moore, George P. McCabe, Bruce A. Craig
Publisher:
W. H. Freeman