Total 20 14-20-7 40 10 20 40 16-20-8103-5 40 A. Using the values shown, find the expected (E) values for each cell, and put them in Table1. Here are the values that were actually observed: REM Sleep Quality Recall Normal Deprived Total High 10 4 14 Moderate 9 7 16 Low Total 1 20 9 10 20 40 B. With these observed values, calculate Chi-square. E= also boon poy,oz ob oT svoris old ads si C. Find the degrees of freedom and determine if your chi-square is significant D. State your conclusions about whether there is a link between recall and slee 2. The following requires using a t-test. A researcher is interested in determinin Rutgers students tend to have higher IQs than the population average of μ= 1 standard deviation, so use the t-test). To address this question, the researcher sample of n = 25 students and administers an IQ test to them. The average fo 105 and the sample standard deviation turns out to be s = 10
Total 20 14-20-7 40 10 20 40 16-20-8103-5 40 A. Using the values shown, find the expected (E) values for each cell, and put them in Table1. Here are the values that were actually observed: REM Sleep Quality Recall Normal Deprived Total High 10 4 14 Moderate 9 7 16 Low Total 1 20 9 10 20 40 B. With these observed values, calculate Chi-square. E= also boon poy,oz ob oT svoris old ads si C. Find the degrees of freedom and determine if your chi-square is significant D. State your conclusions about whether there is a link between recall and slee 2. The following requires using a t-test. A researcher is interested in determinin Rutgers students tend to have higher IQs than the population average of μ= 1 standard deviation, so use the t-test). To address this question, the researcher sample of n = 25 students and administers an IQ test to them. The average fo 105 and the sample standard deviation turns out to be s = 10

MATLAB: An Introduction with Applications
6th Edition
ISBN:9781119256830
Author:Amos Gilat
Publisher:Amos Gilat
Chapter1: Starting With Matlab
Section: Chapter Questions
Problem 1P
Question
Please explain throughly
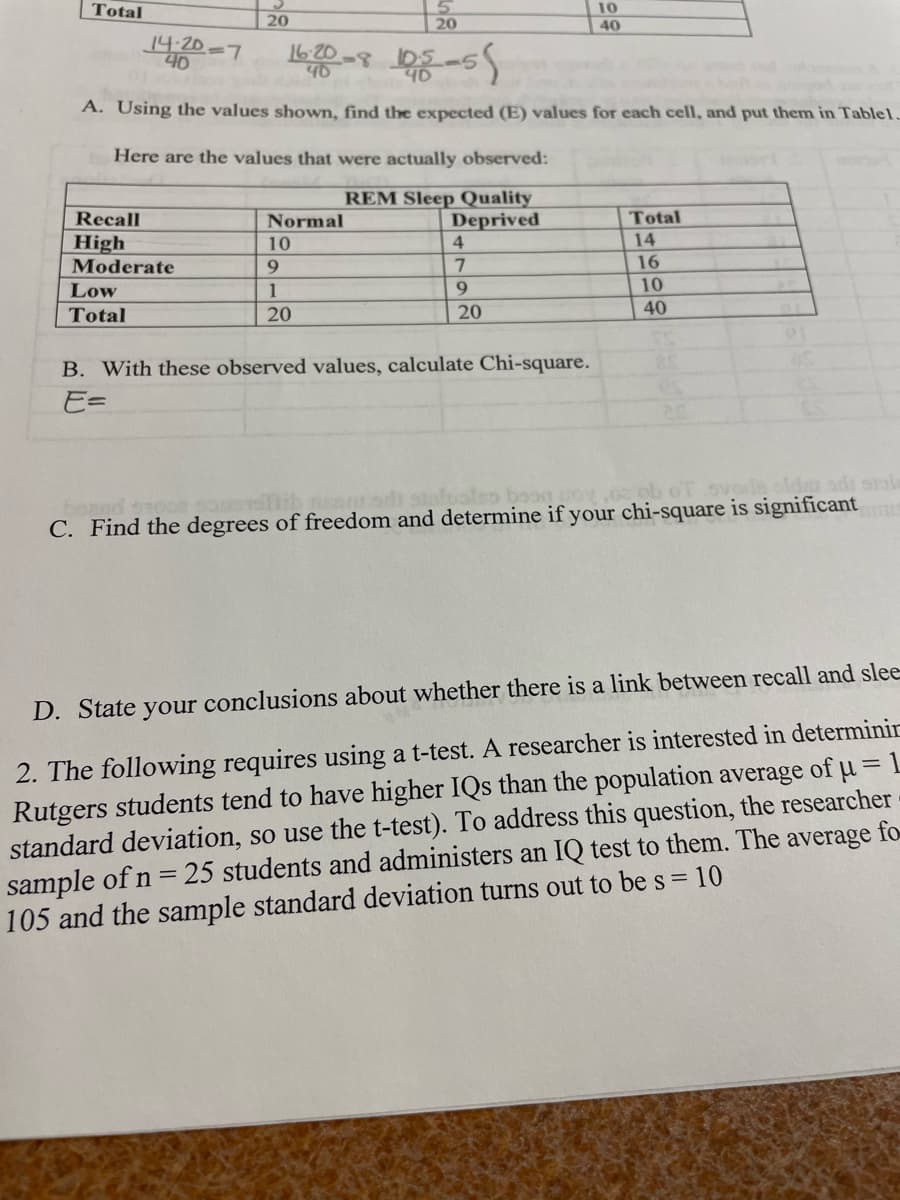
Transcribed Image Text:Total
20
14-20-7
40
10
20
40
16-20-8103-5
40
A. Using the values shown, find the expected (E) values for each cell, and put them in Table1.
Here are the values that were actually observed:
REM Sleep Quality
Recall
Normal
Deprived
Total
High
10
4
14
Moderate
9
7
16
Low
Total
1
20
9
10
20
40
B. With these observed values, calculate Chi-square.
E=
also boon poy,oz ob oT svoris old ads si
C. Find the degrees of freedom and determine if your chi-square is significant
D. State your conclusions about whether there is a link between recall and slee
2. The following requires using a t-test. A researcher is interested in determinin
Rutgers students tend to have higher IQs than the population average of μ= 1
standard deviation, so use the t-test). To address this question, the researcher
sample of n = 25 students and administers an IQ test to them. The average fo
105 and the sample standard deviation turns out to be s = 10
Expert Solution
This question has been solved!
Explore an expertly crafted, step-by-step solution for a thorough understanding of key concepts.

Step by step
Solved in 2 steps

Recommended textbooks for you
MATLAB: An Introduction with Applications
Statistics
ISBN:
9781119256830
Author:
Amos Gilat
Publisher:
John Wiley & Sons Inc

Probability and Statistics for Engineering and th…
Statistics
ISBN:
9781305251809
Author:
Jay L. Devore
Publisher:
Cengage Learning

Statistics for The Behavioral Sciences (MindTap C…
Statistics
ISBN:
9781305504912
Author:
Frederick J Gravetter, Larry B. Wallnau
Publisher:
Cengage Learning
MATLAB: An Introduction with Applications
Statistics
ISBN:
9781119256830
Author:
Amos Gilat
Publisher:
John Wiley & Sons Inc
Probability and Statistics for Engineering and th…
Statistics
ISBN:
9781305251809
Author:
Jay L. Devore
Publisher:
Cengage Learning
Statistics for The Behavioral Sciences (MindTap C…
Statistics
ISBN:
9781305504912
Author:
Frederick J Gravetter, Larry B. Wallnau
Publisher:
Cengage Learning

Elementary Statistics: Picturing the World (7th E…
Statistics
ISBN:
9780134683416
Author:
Ron Larson, Betsy Farber
Publisher:
PEARSON

The Basic Practice of Statistics
Statistics
ISBN:
9781319042578
Author:
David S. Moore, William I. Notz, Michael A. Fligner
Publisher:
W. H. Freeman

Introduction to the Practice of Statistics
Statistics
ISBN:
9781319013387
Author:
David S. Moore, George P. McCabe, Bruce A. Craig
Publisher:
W. H. Freeman