Total number of observations: 47 Inference of Performance Score by Smoker status: Group Means with 95% Confidence Intervals
Total number of observations: 47 Inference of Performance Score by Smoker status: Group Means with 95% Confidence Intervals

MATLAB: An Introduction with Applications
6th Edition
ISBN:9781119256830
Author:Amos Gilat
Publisher:Amos Gilat
Chapter1: Starting With Matlab
Section: Chapter Questions
Problem 1P

Related questions
Question
Write the null and alternative hypotheses for carrying out an analysis of variance (ANOVA) on these data
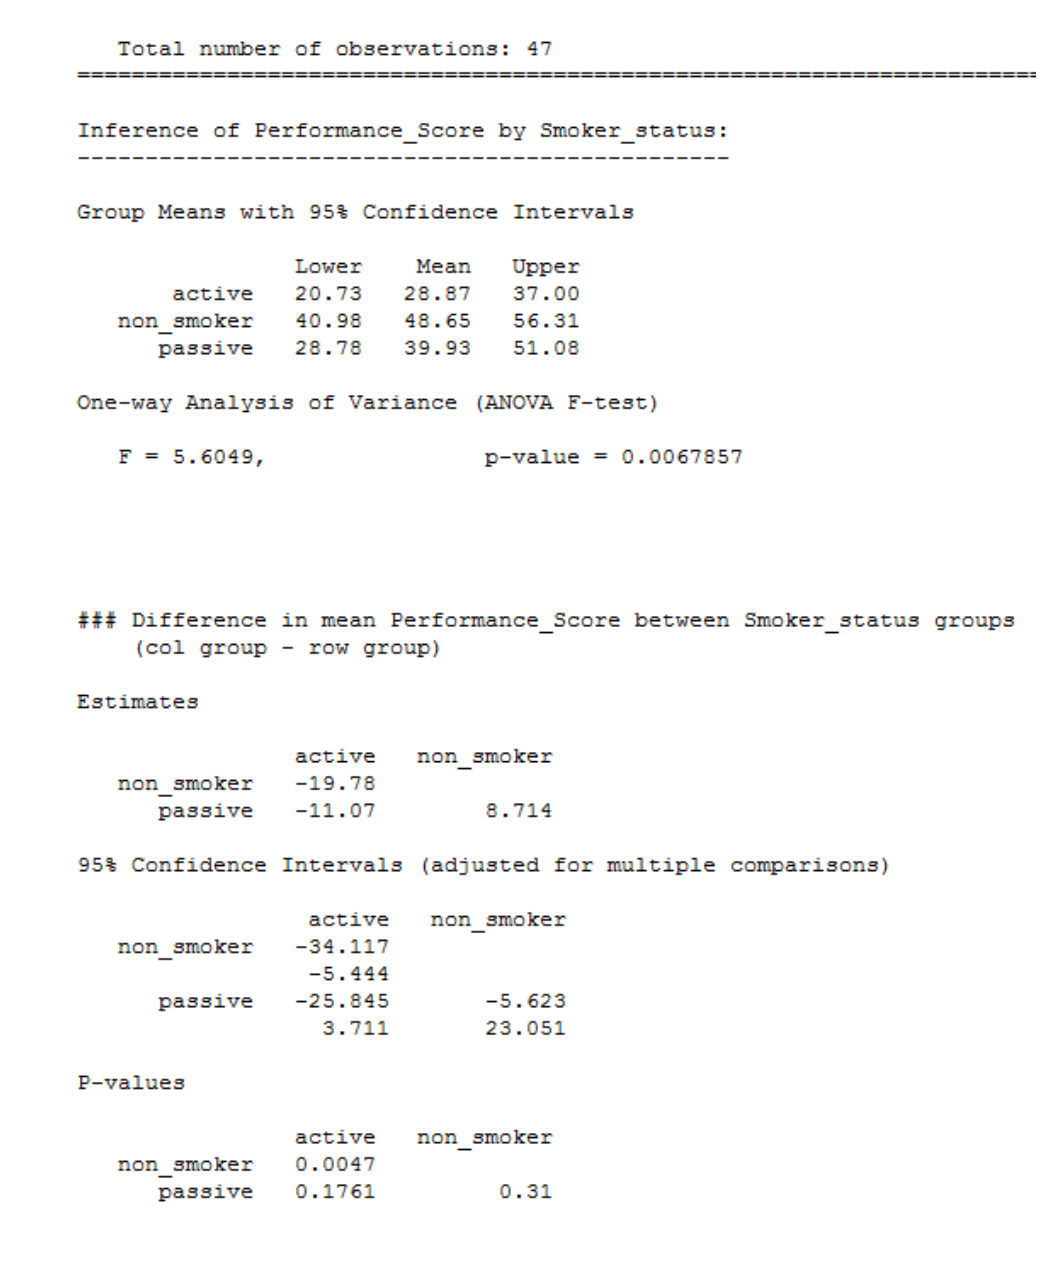
Transcribed Image Text:Total number of observations: 47
======:
Inference of Performance Score by Smoker status:
Group Means with 95 Confidence Intervals
Lower
Mean
Upper
active
20.73
28.87
37.00
non smoker
40.98
48.65
56.31
passive
28.78
39.93
51.08
One-way Analysis of Variance (ANOVA F-test)
F = 5.6049,
p-value = 0.0067857
### Difference in mean Performance_Score between Smoker_status groups
(col group -
row group)
Estimates
active
non smoker
non smoker
-19.78
passive
-11.07
8.714
95% Confidence Intervals (adjusted for multiple comparisons)
active
non smoker
non smoker
-34.117
-5.444
passive
-25.845
-5.623
3.711
23.051
P-values
active
non smoker
non smoker
0.0047
passive
0.1761
0.31
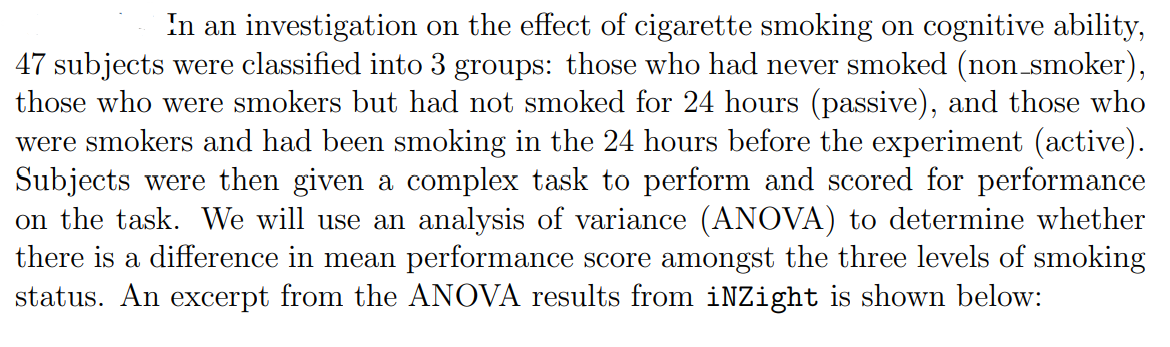
Transcribed Image Text:In an investigation on the effect of cigarette smoking on cognitive ability,
47 subjects were classified into 3 groups: those who had never smoked (non_smoker),
those who were smokers but had not smoked for 24 hours (passive), and those who
were smokers and had been smoking in the 24 hours before the experiment (active).
Subjects were then given a complex task to perform and scored for performance
on the task. We will use an analysis of variance (ANOVA) to determine whether
there is a difference in mean performance score amongst the three levels of smoking
status. An excerpt from the ANOVA results from iNZight is shown below:
Expert Solution
This question has been solved!
Explore an expertly crafted, step-by-step solution for a thorough understanding of key concepts.

Step by step
Solved in 2 steps

Recommended textbooks for you
MATLAB: An Introduction with Applications
Statistics
ISBN:
9781119256830
Author:
Amos Gilat
Publisher:
John Wiley & Sons Inc

Probability and Statistics for Engineering and th…
Statistics
ISBN:
9781305251809
Author:
Jay L. Devore
Publisher:
Cengage Learning

Statistics for The Behavioral Sciences (MindTap C…
Statistics
ISBN:
9781305504912
Author:
Frederick J Gravetter, Larry B. Wallnau
Publisher:
Cengage Learning
MATLAB: An Introduction with Applications
Statistics
ISBN:
9781119256830
Author:
Amos Gilat
Publisher:
John Wiley & Sons Inc
Probability and Statistics for Engineering and th…
Statistics
ISBN:
9781305251809
Author:
Jay L. Devore
Publisher:
Cengage Learning
Statistics for The Behavioral Sciences (MindTap C…
Statistics
ISBN:
9781305504912
Author:
Frederick J Gravetter, Larry B. Wallnau
Publisher:
Cengage Learning

Elementary Statistics: Picturing the World (7th E…
Statistics
ISBN:
9780134683416
Author:
Ron Larson, Betsy Farber
Publisher:
PEARSON

The Basic Practice of Statistics
Statistics
ISBN:
9781319042578
Author:
David S. Moore, William I. Notz, Michael A. Fligner
Publisher:
W. H. Freeman

Introduction to the Practice of Statistics
Statistics
ISBN:
9781319013387
Author:
David S. Moore, George P. McCabe, Bruce A. Craig
Publisher:
W. H. Freeman