Total product (meals per hour) 24 20 TP 16 12 4 2 3 5 Quantity of labor (workers) The figure shows the total product curve for the Fruit Bowl food truck. When labor meals and increases from 1 worker to 2 workers, total product increases to bowls. marginal product equals A) 10; 5 B) 5; 10 O C) 2; 2 D) 10; 2
Total product (meals per hour) 24 20 TP 16 12 4 2 3 5 Quantity of labor (workers) The figure shows the total product curve for the Fruit Bowl food truck. When labor meals and increases from 1 worker to 2 workers, total product increases to bowls. marginal product equals A) 10; 5 B) 5; 10 O C) 2; 2 D) 10; 2

Chapter11: The Firm: Production And Costs
Section: Chapter Questions
Problem 7P

Related questions
Question
100%
Transcribed Image Text:Total product (meals per hour)
24
20
TP
16
12
4
2
3
5
Quantity of labor (workers)
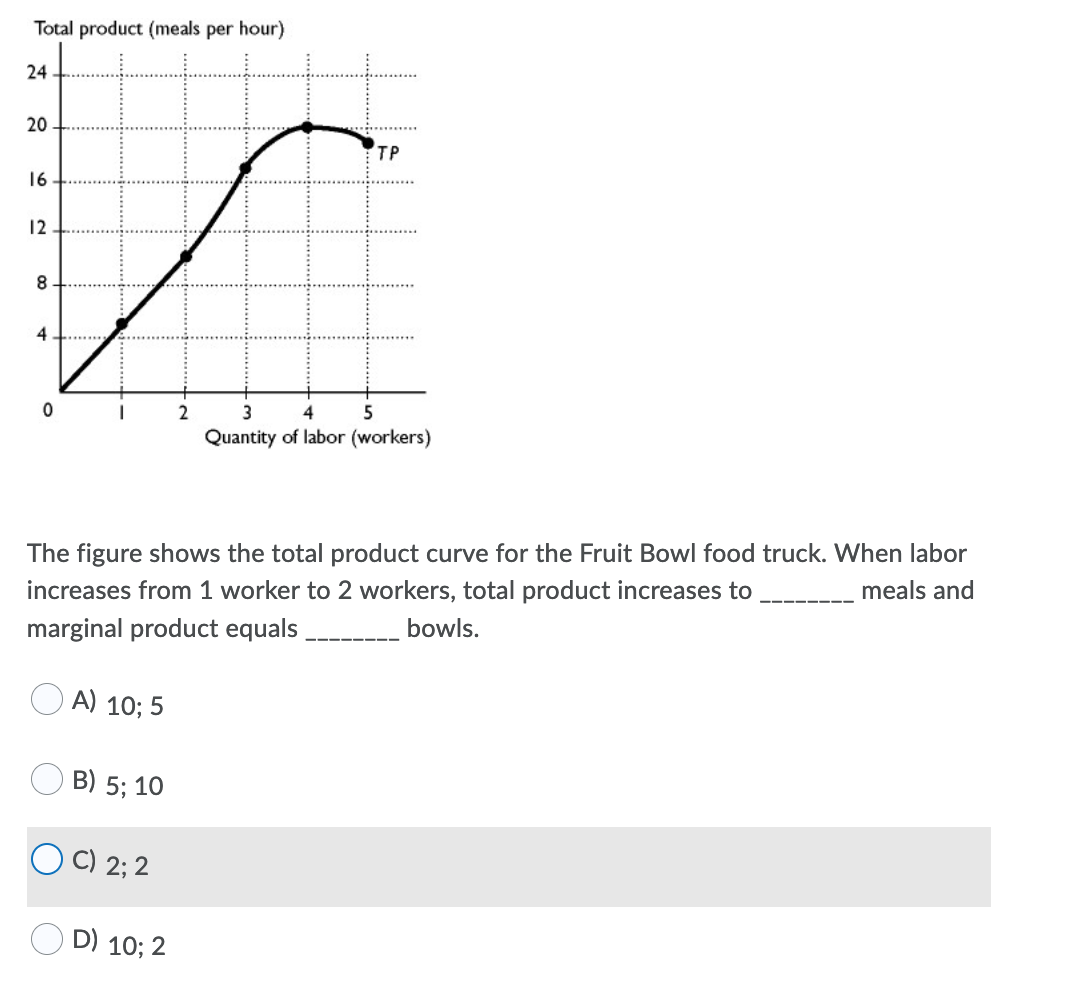
The figure shows the total product curve for the Fruit Bowl food truck. When labor
meals and
increases from 1 worker to 2 workers, total product increases to
bowls.
marginal product equals
A) 10; 5
B) 5; 10
O C) 2; 2
D) 10; 2
Expert Solution
This question has been solved!
Explore an expertly crafted, step-by-step solution for a thorough understanding of key concepts.

This is a popular solution!

Trending now
This is a popular solution!

Step by step
Solved in 2 steps

Knowledge Booster


Learn more about
Need a deep-dive on the concept behind this application? Look no further. Learn more about this topic, economics and related others by exploring similar questions and additional content below.Recommended textbooks for you
Exploring Economics
Economics
ISBN:
9781544336329
Author:
Robert L. Sexton
Publisher:
SAGE Publications, Inc


Exploring Economics
Economics
ISBN:
9781544336329
Author:
Robert L. Sexton
Publisher:
SAGE Publications, Inc


Principles of Economics 2e
Economics
ISBN:
9781947172364
Author:
Steven A. Greenlaw; David Shapiro
Publisher:
OpenStax
