TOTAL Year 1 Sales Budget Hot Beverages Cald Beverages JAN FEB MAR APR MAY JUN JUL AUG SEP OCT NOV DEC 12,400 14,000 17,360 18,000 18,600 18.000 17,360 24.800 18,600 18.000 21,700 23,560 24,000 9.000 228,380 3,100 3,528 4,350 4,500 9.300 10,500 15.750 15,750 10,850 9.300 113,928 Food items 3,000 3,720 4.340 9,000 9,300 9,000 8,680 10,540 11,400 11,780 13,200 16,120 110,080 Caffee and Tea - bulk 1,116 1.260 1,674 1,755 1,953 2,295 2,511 2,650 2,700 2,930 3,105 3,348 27,297 Gift Cards 310 560 620 600 1,240 750 775 775 900 900 1,600 2,100 11,130 Gross Sales 19,926 23,068 28,344 33,855 40,393 40,545 45,076 50,565 52,450 50,020 50,905 55,668 490.815 Less: Returns & Allowances Net Sales 19,926 23,068 28,344 33,855 40,393 40,545 45.076 50,565 52,450 50,020 50,905 55,668 490,815 Other Income Total Income 19,926 23,068 28,344 33,855 40,393 40,545 45.076 50,565 52,450 50.020 50,905 55,668 490,815 Credit Management Sales (cash) 19,926 23.048 28,344 33,855 40,393 40,545 45,076 50,565 52,450 50,020 50,905 55,668 490,815 Sales (credit) Bad Debt Experse - Accrual Received on Account Bad Debt - Cash Flow Assumptions- Year 1 Hot Beverages Cald Beverages Coffee, latte, cappuccino, chai tea Average price $4 Soft drinks, juice, water, tea, frozen coffee drinks Average price $2 Food items Pastries, bagels, desserts Average price $4 for individualS 15 for whole desserts Coffee by the pound; tea bags and loose tea Average price $9 per pound Caffee and Tea - bulk Git Cards Available in any amount Less: Returns & Allowances Other Income Sales (canh) Sales (credit) Bad Debt Experse - Accrual Received on Account Bad Debt - Cash Flow YEAR 1 YEAR 1 YE AR 1 YEAR YE AR 1 YE AR 1 YE AR 1


Master Budget
A master budget can be defined as an estimation of the revenue earned or expenses incurred over a specified period of time in the future and it is generally prepared on a periodic basis which can be either monthly, quarterly, half-yearly, or annually. It helps a business, an organization, or even an individual to manage the money effectively. A budget also helps in monitoring the performance of the people in the organization and helps in better decision-making.
Sales Budget and Selling
A budget is a financial plan designed by an undertaking for a definite period in future which acts as a major contributor towards enhancing the financial success of the business undertaking. The budget generally takes into account both current and future income and expenses.
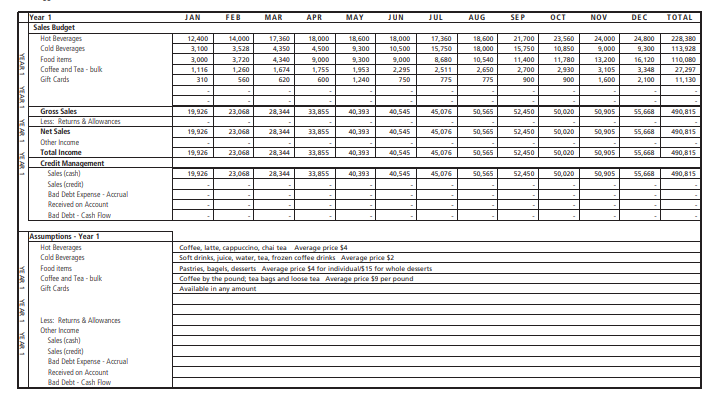
You have been provided with monthly sales projections for year one for Maggie’s Coffee Café. Use these projections to answer the following:
- Based on the sales projections for Maggie’s Coffee Cafe determine:
Sales per day for the first month they are open (January) ______________
Sales per day for the 6th month they are open (June) ______________
Sales per day for the 12th month they are open (December) ______________
(assume the business is open 7 days/week; Jan and Dec have 31 days; June has 30)
- Which month has the highest sales? Which month has the lowest sales? Why do you think this is so?
1.)
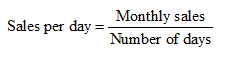
Formula:
- Sales per day for January:
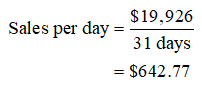
Hence, the Sales per day for the first month they are open (January) is $642.77.
- Sales per day for June:
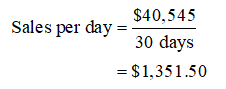
Hence, the Sales per day for the 6th month they are open (June) is $1,351.50.

Step by step
Solved in 5 steps with 4 images


