Tour Company gave bus tours last summer. The tour director noted the number of Summary values people served by each of the 22 tours. The smallest number of people served was 45, and the largest was 51. The table gives the mean, median, range, and interquartile range (IQR) of the data set. Mean Median Range IQR 47 46 6 3 (a) Select the best description of spread for the data set. (b) Select the best description of center for the data set. OBased on the median and mean, we see that the OThe middle half of the data set is 22 units wide. (This is the number of tours given.) "average" number of people served was about 46 or 47. OThe middle half of the data set is 46 units wide. (This is OBased on the IQR, we see that the "average" number of the median.) people served was about 3. OThe middle half of the data set is 3 units wide. (This is OBased on the range, we see that the "average" number the IQR.) of people served was about 6. (c) Select the graph with the shape that best fits the summary values. O Graph 1 (The data set is symmetric.) OGraph 2 (The data set is not symmetric.) 45 46 47 48 49 50 51 45 46 47 48 49 50 51 Number of people served Number of people served Number of tours Number of tours
Tour Company gave bus tours last summer. The tour director noted the number of Summary values people served by each of the 22 tours. The smallest number of people served was 45, and the largest was 51. The table gives the mean, median, range, and interquartile range (IQR) of the data set. Mean Median Range IQR 47 46 6 3 (a) Select the best description of spread for the data set. (b) Select the best description of center for the data set. OBased on the median and mean, we see that the OThe middle half of the data set is 22 units wide. (This is the number of tours given.) "average" number of people served was about 46 or 47. OThe middle half of the data set is 46 units wide. (This is OBased on the IQR, we see that the "average" number of the median.) people served was about 3. OThe middle half of the data set is 3 units wide. (This is OBased on the range, we see that the "average" number the IQR.) of people served was about 6. (c) Select the graph with the shape that best fits the summary values. O Graph 1 (The data set is symmetric.) OGraph 2 (The data set is not symmetric.) 45 46 47 48 49 50 51 45 46 47 48 49 50 51 Number of people served Number of people served Number of tours Number of tours

Glencoe Algebra 1, Student Edition, 9780079039897, 0079039898, 2018
18th Edition
ISBN:9780079039897
Author:Carter
Publisher:Carter
Chapter10: Statistics
Section: Chapter Questions
Problem 25SGR

Related questions
Question
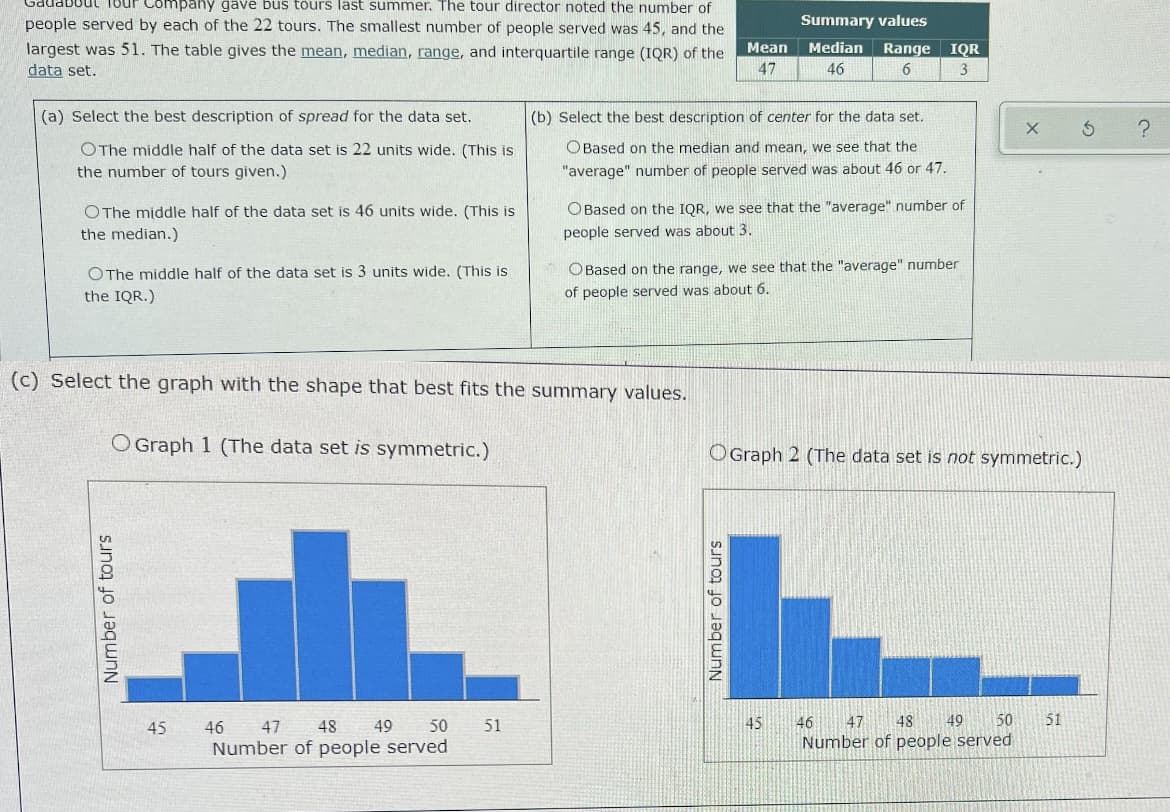
Transcribed Image Text:Tour Company gave bus tours last summer. The tour director noted the number of
people served by each of the 22 tours. The smallest number of people served was 45, and the
Summary values
largest was 51. The table gives the mean, median, range, and interquartile range (IQR) of the
data set.
Mean
Median
Range
IQR
47
46
3
(a) Select the best description of spread for the data set.
(b) Select the best description of center for the data set.
OBased on the median and mean, we see that the
OThe middle half of the data set is 22 units wide. (This is
the number of tours given.)
"average" number of people served was about 46 or 47.
OThe middle half of the data set is 46 units wide. (This is
OBased on the IQR, we see that the "average" number of
the median.)
people served was about 3.
OThe middle half of the data set is 3 units wide. (This is
OBased on the range, we see that the "average" number
the IQR.)
of people served was about 6.
(c) Select the graph with the shape that best fits the summary values.
O Graph 1 (The data set is symmetric.)
OGraph 2 (The data set is not symmetric.)
45
46
47 48
49
50
51
45
46
47
48
49 50
51
Number of people served
Number of people served
Number of tours
Number of tours
Expert Solution
This question has been solved!
Explore an expertly crafted, step-by-step solution for a thorough understanding of key concepts.

This is a popular solution!

Trending now
This is a popular solution!

Step by step
Solved in 2 steps with 1 images

Recommended textbooks for you
Glencoe Algebra 1, Student Edition, 9780079039897…
Algebra
ISBN:
9780079039897
Author:
Carter
Publisher:
McGraw Hill

Holt Mcdougal Larson Pre-algebra: Student Edition…
Algebra
ISBN:
9780547587776
Author:
HOLT MCDOUGAL
Publisher:
HOLT MCDOUGAL
Glencoe Algebra 1, Student Edition, 9780079039897…
Algebra
ISBN:
9780079039897
Author:
Carter
Publisher:
McGraw Hill
Holt Mcdougal Larson Pre-algebra: Student Edition…
Algebra
ISBN:
9780547587776
Author:
HOLT MCDOUGAL
Publisher:
HOLT MCDOUGAL