) Draw a scatter diagram of the data. Choose the correct graph below. O A. OB. Oc. OD. A Drownings ALyme Disease 20- ADrownings 20- ADrownings 20- Lyme Disease Drownings Lyme Disease Lyme Disease
) Draw a scatter diagram of the data. Choose the correct graph below. O A. OB. Oc. OD. A Drownings ALyme Disease 20- ADrownings 20- ADrownings 20- Lyme Disease Drownings Lyme Disease Lyme Disease

Linear Algebra: A Modern Introduction
4th Edition
ISBN:9781285463247
Author:David Poole
Publisher:David Poole
Chapter4: Eigenvalues And Eigenvectors
Section4.6: Applications And The Perron-frobenius Theorem
Problem 22EQ

Related questions
Question
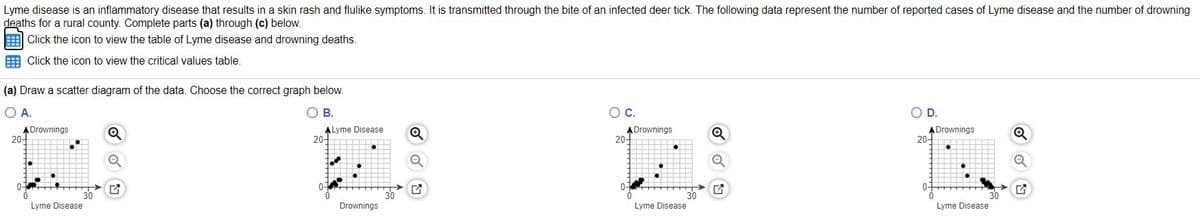
Transcribed Image Text:Lyme disease is an inflammatory disease that results in a skin rash and flulike symptoms. It is transmitted through the bite of an infected deer tick. The following data represent the number of reported cases of Lyme disease and the number of drowning
deaths for a rural county. Complete parts (a) through (c) below.
E Click the icon to view the table of Lyme disease and drowning deaths.
E Click the icon to view the critical values table.
(a) Draw a scatter diagram of the data. Choose the correct graph below.
O A.
OB.
OC.
OD.
ADrownings
20-
ALyme Disease
20-
A Drownings
20-
A Drownings
20-
0-
30
30
Drownings
30
Lyme Disease
Lyme Disease
Lyme Disease
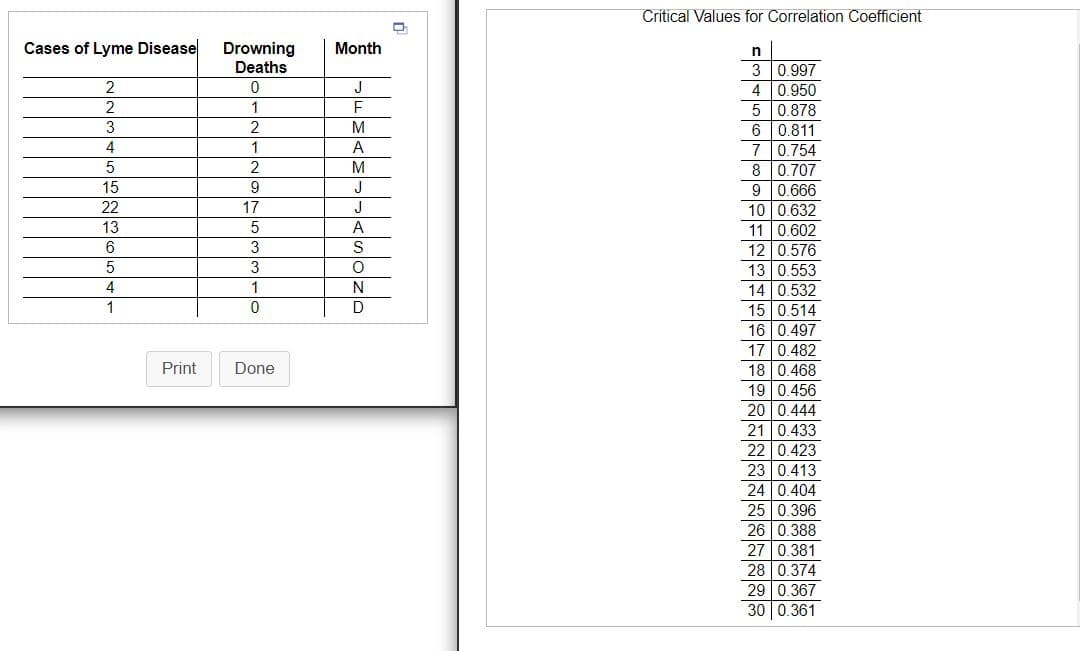
Transcribed Image Text:Critical Values for Correlation Coefficient
Cases of Lyme Disease
Drowning
Deaths
Month
3 0.997
2
J
0.950
5 0.878
6 0.811
7 0.754
0.707
0.666
2
1
F
3
M
4
1
A
5
2
M
8
15
9
J
9
22
17
J
10 0.632
13
A
11 0.602
12 0.576
6
3
S
3
13 0.553
4
1
N
14 0.532
15 0.514
16 0.497
17 0.482
18 0.468
1
Print
Done
19 0.456
20 0.444
21 0.433
22 0.423
23 0.413
24 0.404
25 0.396
26 0.388
27 0.381
28 0.374
29 0.367
30 0.361
Expert Solution
This question has been solved!
Explore an expertly crafted, step-by-step solution for a thorough understanding of key concepts.

This is a popular solution!

Trending now
This is a popular solution!

Step by step
Solved in 2 steps with 1 images

Knowledge Booster


Learn more about
Need a deep-dive on the concept behind this application? Look no further. Learn more about this topic, statistics and related others by exploring similar questions and additional content below.Recommended textbooks for you
Linear Algebra: A Modern Introduction
Algebra
ISBN:
9781285463247
Author:
David Poole
Publisher:
Cengage Learning

Glencoe Algebra 1, Student Edition, 9780079039897…
Algebra
ISBN:
9780079039897
Author:
Carter
Publisher:
McGraw Hill

Holt Mcdougal Larson Pre-algebra: Student Edition…
Algebra
ISBN:
9780547587776
Author:
HOLT MCDOUGAL
Publisher:
HOLT MCDOUGAL
Linear Algebra: A Modern Introduction
Algebra
ISBN:
9781285463247
Author:
David Poole
Publisher:
Cengage Learning
Glencoe Algebra 1, Student Edition, 9780079039897…
Algebra
ISBN:
9780079039897
Author:
Carter
Publisher:
McGraw Hill
Holt Mcdougal Larson Pre-algebra: Student Edition…
Algebra
ISBN:
9780547587776
Author:
HOLT MCDOUGAL
Publisher:
HOLT MCDOUGAL

Big Ideas Math A Bridge To Success Algebra 1: Stu…
Algebra
ISBN:
9781680331141
Author:
HOUGHTON MIFFLIN HARCOURT
Publisher:
Houghton Mifflin Harcourt