trong Covid-19 antibodies typically appear about 2 to 4 weeks after complete vaccination. A researcher took a random sample of 15 Covid-19 patients and, for each of these, determined the number of days after complete vaccination that antibod ppeared. The following are the number of days for each of the patients in our sample: 2, 18, 17, 4, 30, 22, 21, 17, 19, 14, 22, 26, 14, 18, 29 is reasonable to treat these measurements as coming from a normal distribution with unknowwn mean a and unknovn standard deviation o Calculate the sample mean of this data. Calculate the sample variance of this data. Use the R, IQR( ) function to find the interquartile range of this data.
trong Covid-19 antibodies typically appear about 2 to 4 weeks after complete vaccination. A researcher took a random sample of 15 Covid-19 patients and, for each of these, determined the number of days after complete vaccination that antibod ppeared. The following are the number of days for each of the patients in our sample: 2, 18, 17, 4, 30, 22, 21, 17, 19, 14, 22, 26, 14, 18, 29 is reasonable to treat these measurements as coming from a normal distribution with unknowwn mean a and unknovn standard deviation o Calculate the sample mean of this data. Calculate the sample variance of this data. Use the R, IQR( ) function to find the interquartile range of this data.

Holt Mcdougal Larson Pre-algebra: Student Edition 2012
1st Edition
ISBN:9780547587776
Author:HOLT MCDOUGAL
Publisher:HOLT MCDOUGAL
Chapter11: Data Analysis And Probability
Section: Chapter Questions
Problem 8CR

Related questions
Question
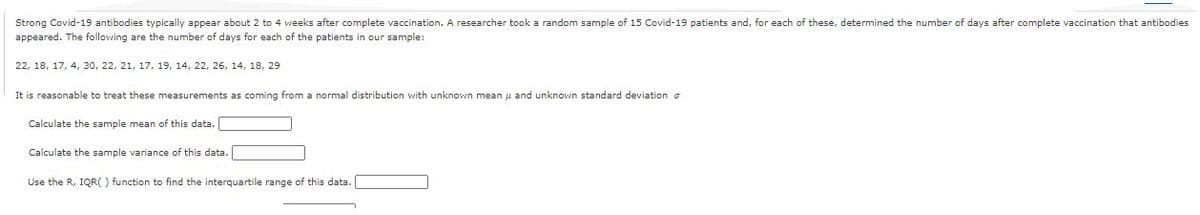
Transcribed Image Text:Strong Covid-19 antibodies typically appear about 2 to 4 weeks after complete vaccination. A researcher took a random sample of 15 Covid-19 patients and, for each of these, determined the number of days after complete vaccination that antibodies
appeared. The following are the number of days for each of the patients in our sample:
22, 18, 17, 4, 30, 22, 21, 17, 19, 14, 22, 26, 14, 18, 29
It is reasonable to treat these measurements as coming from a normal distribution with unknown mean u and unknown standard deviation o
Calculate the sample mean of this data.
Calculate the sample variance of this data.
Use the R, IQR( ) function to find the interquartile range of this data.
Expert Solution
This question has been solved!
Explore an expertly crafted, step-by-step solution for a thorough understanding of key concepts.

Step by step
Solved in 2 steps with 1 images

Recommended textbooks for you
Holt Mcdougal Larson Pre-algebra: Student Edition…
Algebra
ISBN:
9780547587776
Author:
HOLT MCDOUGAL
Publisher:
HOLT MCDOUGAL

Algebra & Trigonometry with Analytic Geometry
Algebra
ISBN:
9781133382119
Author:
Swokowski
Publisher:
Cengage

Holt Mcdougal Larson Pre-algebra: Student Edition…
Algebra
ISBN:
9780547587776
Author:
HOLT MCDOUGAL
Publisher:
HOLT MCDOUGAL
Algebra & Trigonometry with Analytic Geometry
Algebra
ISBN:
9781133382119
Author:
Swokowski
Publisher:
Cengage