Two different simple random samples are drawn from two different populations. The first sample consists of 30 people with 16 having a common attribute. sample consists of 2200 people with 1603 of them having the same common attribute. Compare the results from a hypothesis test of p, =P2 (with a 0.01 si level) and a 99% confidence interval estimate of p, - p2- What are the null and alternative hypotheses for the hypothesis test? O A. Ho: P1 = P2 H: P1 > P2 O B. Ho: P1 = P2 H:P1 #P2 OC. Ho: P1 Sp2 H1: P1 #P2 O F. Ho: P1 = P2 O E. Ho: P1 2 P2 H1: P1 #P2 O D. Ho: P1 # P2 H1: P1 = P2 H;: P1
Two different simple random samples are drawn from two different populations. The first sample consists of 30 people with 16 having a common attribute. sample consists of 2200 people with 1603 of them having the same common attribute. Compare the results from a hypothesis test of p, =P2 (with a 0.01 si level) and a 99% confidence interval estimate of p, - p2- What are the null and alternative hypotheses for the hypothesis test? O A. Ho: P1 = P2 H: P1 > P2 O B. Ho: P1 = P2 H:P1 #P2 OC. Ho: P1 Sp2 H1: P1 #P2 O F. Ho: P1 = P2 O E. Ho: P1 2 P2 H1: P1 #P2 O D. Ho: P1 # P2 H1: P1 = P2 H;: P1

MATLAB: An Introduction with Applications
6th Edition
ISBN:9781119256830
Author:Amos Gilat
Publisher:Amos Gilat
Chapter1: Starting With Matlab
Section: Chapter Questions
Problem 1P

Related questions
Topic Video
Question
Transcribed Image Text:Photos 2
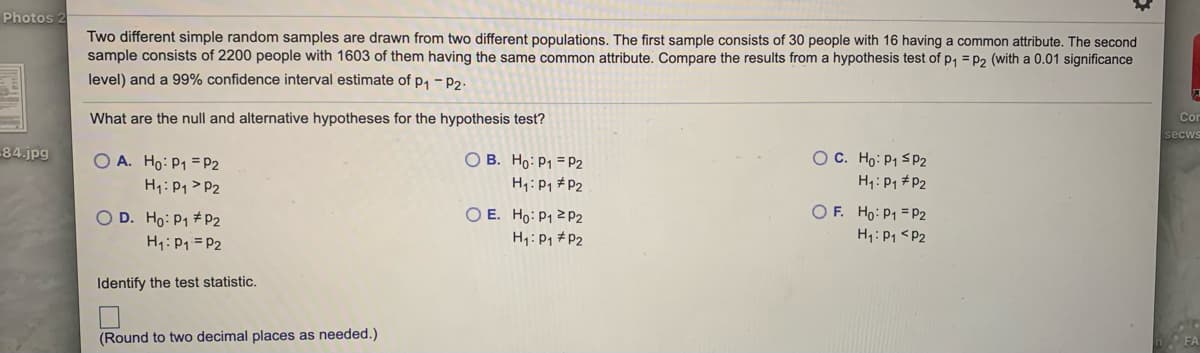
Two different simple random samples are drawn from two different populations. The first sample consists of 30 people with 16 having a common attribute. The second
sample consists of 2200 people with 1603 of them having the same common attribute. Compare the results from a hypothesis test of p, =P2 (with a 0.01 significance
level) and a 99% confidence interval estimate of p, - P2-
What are the null and alternative hypotheses for the hypothesis test?
Cor
secws
-84.jpg
O C. Ho: P1 S 2
O A. Ho: P1 = P2
H1:P1> P2
O B. Ho: P1 = P2
H1: P1 #P2
H1: P1 #P2
O D. Ho: P1 # P2
H1: P1 = P2
O E. Ho: P1 2 P2
H1:P1 # P2
O F. Ho: P1 = P2
H1: P1 <P2
Identify the test statistic.
(Round to two decimal places as needed.)
Transcribed Image Text:Maternity Photos 2
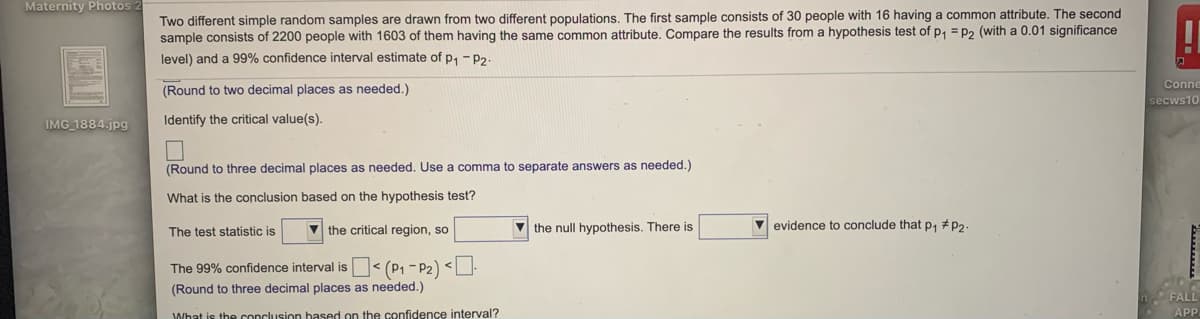
Two different simple random samples are drawn from two different populations. The first sample consists of 30 people with 16 having a common attribute. The second
sample consists of 2200 people with 1603 of them having the same common attribute. Compare the results from a hypothesis test of p, = P2 (with a 0.01 significance
level) and a 99% confidence interval estimate of p, - P2.
Conne
(Round to two decimal places as needed.)
secws10
IMG 1884.jpg
Identify the critical value(s).
(Round to three decimal places as needed. Use a comma to separate answers as needed.)
What is the conclusion based on the hypothesis test?
The test statistic is
V the critical region, so
V the null hypothesis. There is
V evidence to conclude that p, #p2
The 99% confidence interval is < (P1 - P2) <U-
(Round to three decimal places as needed.)
FALL
APP
What is the conclusion hased on the confidence interval?
Expert Solution
This question has been solved!
Explore an expertly crafted, step-by-step solution for a thorough understanding of key concepts.

This is a popular solution!

Trending now
This is a popular solution!

Step by step
Solved in 2 steps with 2 images

Knowledge Booster


Learn more about
Need a deep-dive on the concept behind this application? Look no further. Learn more about this topic, statistics and related others by exploring similar questions and additional content below.Recommended textbooks for you
MATLAB: An Introduction with Applications
Statistics
ISBN:
9781119256830
Author:
Amos Gilat
Publisher:
John Wiley & Sons Inc

Probability and Statistics for Engineering and th…
Statistics
ISBN:
9781305251809
Author:
Jay L. Devore
Publisher:
Cengage Learning

Statistics for The Behavioral Sciences (MindTap C…
Statistics
ISBN:
9781305504912
Author:
Frederick J Gravetter, Larry B. Wallnau
Publisher:
Cengage Learning
MATLAB: An Introduction with Applications
Statistics
ISBN:
9781119256830
Author:
Amos Gilat
Publisher:
John Wiley & Sons Inc
Probability and Statistics for Engineering and th…
Statistics
ISBN:
9781305251809
Author:
Jay L. Devore
Publisher:
Cengage Learning
Statistics for The Behavioral Sciences (MindTap C…
Statistics
ISBN:
9781305504912
Author:
Frederick J Gravetter, Larry B. Wallnau
Publisher:
Cengage Learning

Elementary Statistics: Picturing the World (7th E…
Statistics
ISBN:
9780134683416
Author:
Ron Larson, Betsy Farber
Publisher:
PEARSON

The Basic Practice of Statistics
Statistics
ISBN:
9781319042578
Author:
David S. Moore, William I. Notz, Michael A. Fligner
Publisher:
W. H. Freeman

Introduction to the Practice of Statistics
Statistics
ISBN:
9781319013387
Author:
David S. Moore, George P. McCabe, Bruce A. Craig
Publisher:
W. H. Freeman