Two different simple random samples are drawn from two different populations. The first sample consists of 30 people with 15 having a common attribute. The second sample consists of 2200 people with 1570 of them having the same common attribute Compare the results from a hypothesis test of P₁ P₂ (with a 0.05 significance level) and a 95% confidence interval estimate of p₁ -P₂ CE What are the null and alternative hypotheses for the hypothesis test? OA. Ho P₁ P₂ OB. Ho P₁ P₂ OC. Ho P₁ P₂ H₁ P₁ P2 H₁ P₁ P2 H₁ P₁ P2 OD. Ho P₁ P2 OE. Ho P1 P₂ OF. Ho P1 P2 H₁ P₁ P₂ H₁ P₁ P₂ H₁ P₁ P2 Identify the test statistic 0 (Round to two decimal places as needed) Identify the critical value(s) (Round to three decimal places as needed. Use a comma What is the conclusion based on the hypothesis test? The test statistic is t the critical region, so The 95% confidence interval is < (P₁-P₂) < (Round to three decimal places as needed) What is the conclusion based on the confidence interval? Next separate answers as needed)) the null hypothesis. There is evidence to conclude that p₁ #p₂
Two different simple random samples are drawn from two different populations. The first sample consists of 30 people with 15 having a common attribute. The second sample consists of 2200 people with 1570 of them having the same common attribute Compare the results from a hypothesis test of P₁ P₂ (with a 0.05 significance level) and a 95% confidence interval estimate of p₁ -P₂ CE What are the null and alternative hypotheses for the hypothesis test? OA. Ho P₁ P₂ OB. Ho P₁ P₂ OC. Ho P₁ P₂ H₁ P₁ P2 H₁ P₁ P2 H₁ P₁ P2 OD. Ho P₁ P2 OE. Ho P1 P₂ OF. Ho P1 P2 H₁ P₁ P₂ H₁ P₁ P₂ H₁ P₁ P2 Identify the test statistic 0 (Round to two decimal places as needed) Identify the critical value(s) (Round to three decimal places as needed. Use a comma What is the conclusion based on the hypothesis test? The test statistic is t the critical region, so The 95% confidence interval is < (P₁-P₂) < (Round to three decimal places as needed) What is the conclusion based on the confidence interval? Next separate answers as needed)) the null hypothesis. There is evidence to conclude that p₁ #p₂

College Algebra (MindTap Course List)
12th Edition
ISBN:9781305652231
Author:R. David Gustafson, Jeff Hughes
Publisher:R. David Gustafson, Jeff Hughes
Chapter8: Sequences, Series, And Probability
Section8.7: Probability
Problem 58E: What is meant by the sample space of an experiment?

Related questions
Question
100%
Please help. The question didn't fit into one pic so there's two. Thanks so much
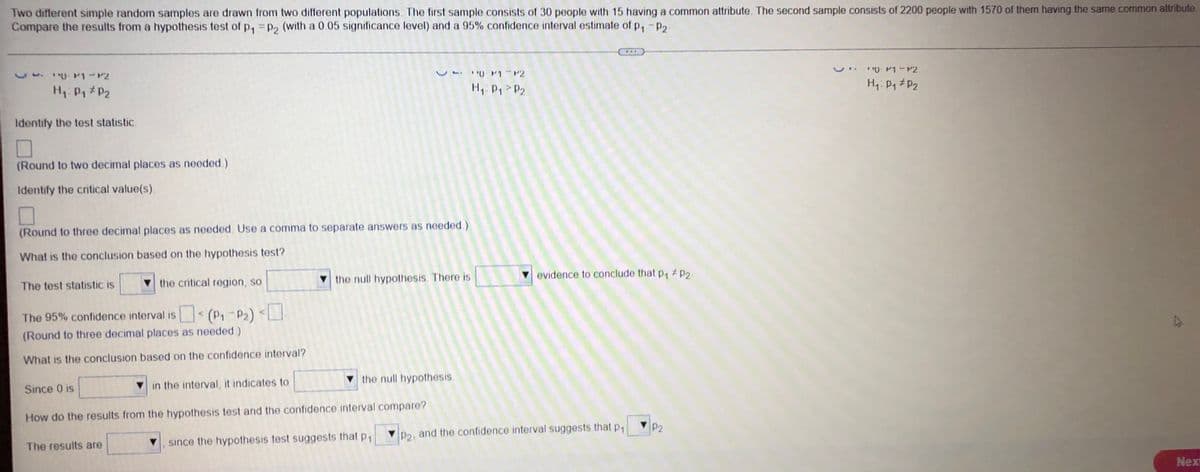
Transcribed Image Text:Two different simple random samples are drawn from two different populations. The first sample consists of 30 people with 15 having a common attribute. The second sample consists of 2200 people with 1570 of them having the same common attribute
Compare the results from a hypothesis test of p₁ = P2 (with a 0.05 significance level) and a 95% confidence interval estimate of P₁ P2
**P1-P2
VP1 P2
VM-P2
H₁: P₁ P₂
H₁: P₁ P2
H₁: P₁ P₂
Identify the test statistic.
(Round to two decimal places as needed.)
Identify the critical value(s).
(Round to three decimal places as needed. Use a comma to separate answers as needed.)
What is the conclusion based on the hypothesis test?
evidence to conclude that p₁ # P2.
The test statistic is
the critical region, so
the null hypothesis. There is
The 95% confidence interval is < (P₁-P₂) <
(Round to three decimal places as needed.)
What is the conclusion based on the confidence interval?
the null hypothesis.
Since 0 is
in the interval, it indicates to
How do the results from the hypothesis test and the confidence interval compare?
The results are
P2-
since the hypothesis test suggests that p₁
Next
P2, and the confidence interval suggests that p₁
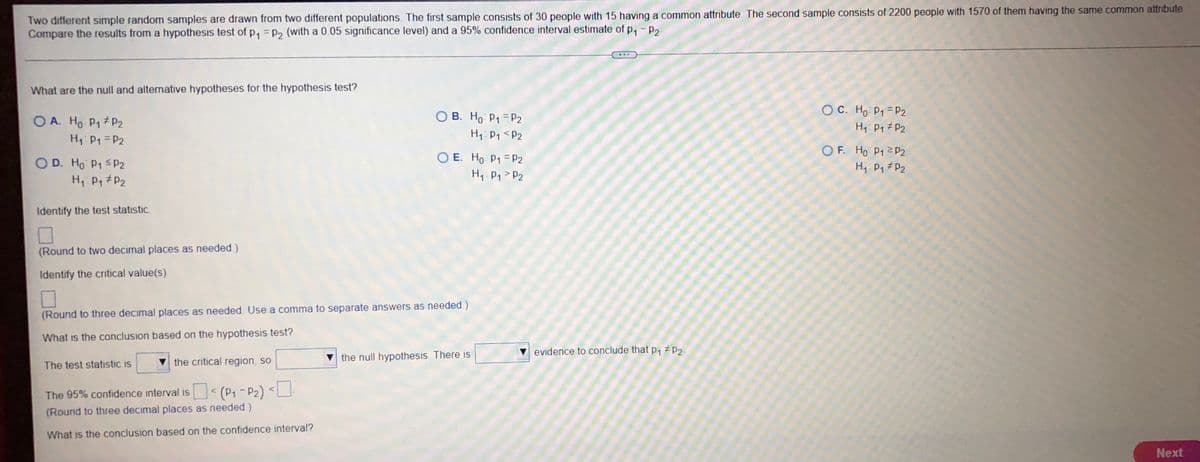
Transcribed Image Text:Two different simple random samples are drawn from two different populations. The first sample consists of 30 people with 15 having a common attribute. The second sample consists of 2200 people with 1570 of them having the same common attribute
Compare the results from a hypothesis test of p₁ = P₂ (with a 0.05 significance level) and a 95% confidence interval estimate of P₁ -P₂-
What are the null and alternative hypotheses for the hypothesis test?
OC. Ho P1 P2
OA. Ho P₁ P₂
OB. Ho: P₁
P2
H₁: P₁ P2
H₁: P₁ P₂
H₁: P1 = P2
OD. Ho: P1 P2
OE. Ho: P1
P2
OF. Ho P12 P2
H₁: P₁ P₂
H₁ P₁
H₁ P₁ P₂
P₂
Identify the test statistic
(Round to two decimal places as needed.)
Identify the critical value(s).
(Round to three decimal places as needed. Use a comma to separate answers as needed.)
What is the conclusion based on the hypothesis test?
The test statistic is
the critical region, so
the null hypothesis. There is
The 95% confidence interval is < (P₁-P₂) <
(Round to three decimal places as needed)
What is the conclusion based on the confidence interval?
Next
evidence to conclude that p₁ #P₂.
Expert Solution
This question has been solved!
Explore an expertly crafted, step-by-step solution for a thorough understanding of key concepts.

This is a popular solution!

Trending now
This is a popular solution!

Step by step
Solved in 2 steps with 2 images

Recommended textbooks for you
College Algebra (MindTap Course List)
Algebra
ISBN:
9781305652231
Author:
R. David Gustafson, Jeff Hughes
Publisher:
Cengage Learning
College Algebra (MindTap Course List)
Algebra
ISBN:
9781305652231
Author:
R. David Gustafson, Jeff Hughes
Publisher:
Cengage Learning