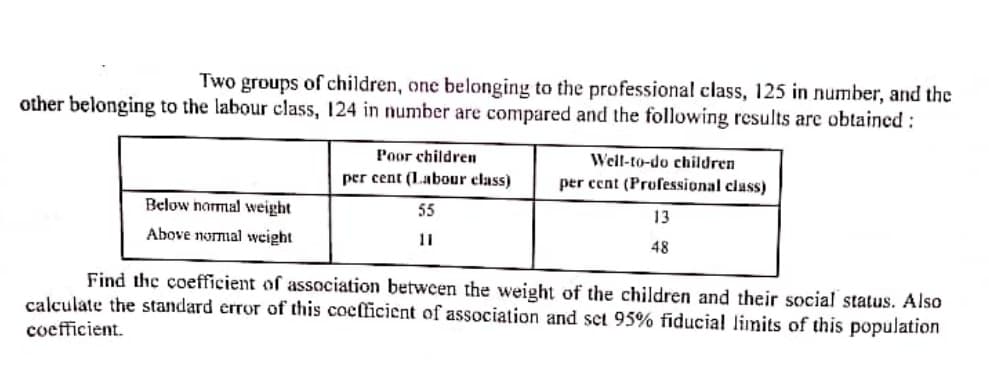
Two groups of children, one belonging to the professional class, 125 in number, and the other belonging to the labour class, 124 in number are compared and the following results are obtained: Poor children Well-to-do children per cent (Labour elass) per cent (Professional class) Below narmal weight 55 13 Above normial weight 11 48 Find the coefficient of association between the weight of the children and their social status. Also calculate the standard error of this coefficient of association and set 95% fiducia! limits of this population coefficient.
Two groups of children, one belonging to the professional class, 125 in number, and the other belonging to the labour class, 124 in number are compared and the following results are obtained: Poor children Well-to-do children per cent (Labour elass) per cent (Professional class) Below narmal weight 55 13 Above normial weight 11 48 Find the coefficient of association between the weight of the children and their social status. Also calculate the standard error of this coefficient of association and set 95% fiducia! limits of this population coefficient.

Glencoe Algebra 1, Student Edition, 9780079039897, 0079039898, 2018
18th Edition
ISBN:9780079039897
Author:Carter
Publisher:Carter
Chapter10: Statistics
Section10.3: Measures Of Spread
Problem 1GP

Related questions
Question
Transcribed Image Text:Two groups of children, one belonging to the professional class, 125 in number, and the
other belonging to the labour class, 124 in number are compared and the following results are obtained:
Poor children
Well-to-do children
per cent (Labour elass)
per cent (Professional class)
Below narmal weight
55
13
Above normal weight
11
48
Find the coefficient of association between the weight of the children and their social status. Also
calculate the standard error of this coefficient of association and set 95% fiducia! limits of this population
coefficient.
Expert Solution
This question has been solved!
Explore an expertly crafted, step-by-step solution for a thorough understanding of key concepts.

Step by step
Solved in 3 steps with 3 images

Recommended textbooks for you
Glencoe Algebra 1, Student Edition, 9780079039897…
Algebra
ISBN:
9780079039897
Author:
Carter
Publisher:
McGraw Hill
Glencoe Algebra 1, Student Edition, 9780079039897…
Algebra
ISBN:
9780079039897
Author:
Carter
Publisher:
McGraw Hill