Two models, R, = 9.21+0.62t and R, =9.21+0.45t , are given for revenue (in billions of dollars per year) for a large corporation. Both models are estimates of revenues for 2007 through 2011, with t= 7 corresponding to 2007. Which model is projecting the greater revenue? How much more total revenue does that model project over the five- year period? A) The model R, projects greater revenue than R,. $9.65 billion B) The model R, projects greater revenue than R,. SES $8.65 billion C) The model R, projects greater revenue than R,. $7.65 billion D) The modelR projects greater revenue than R,. $11.65 billion E) The model R, projects greater revenue than R,. e solhou poze $17.65 billion
Two models, R, = 9.21+0.62t and R, =9.21+0.45t , are given for revenue (in billions of dollars per year) for a large corporation. Both models are estimates of revenues for 2007 through 2011, with t= 7 corresponding to 2007. Which model is projecting the greater revenue? How much more total revenue does that model project over the five- year period? A) The model R, projects greater revenue than R,. $9.65 billion B) The model R, projects greater revenue than R,. SES $8.65 billion C) The model R, projects greater revenue than R,. $7.65 billion D) The modelR projects greater revenue than R,. $11.65 billion E) The model R, projects greater revenue than R,. e solhou poze $17.65 billion

Chapter17: Capital And Time
Section: Chapter Questions
Problem 17.2P

Related questions
Question
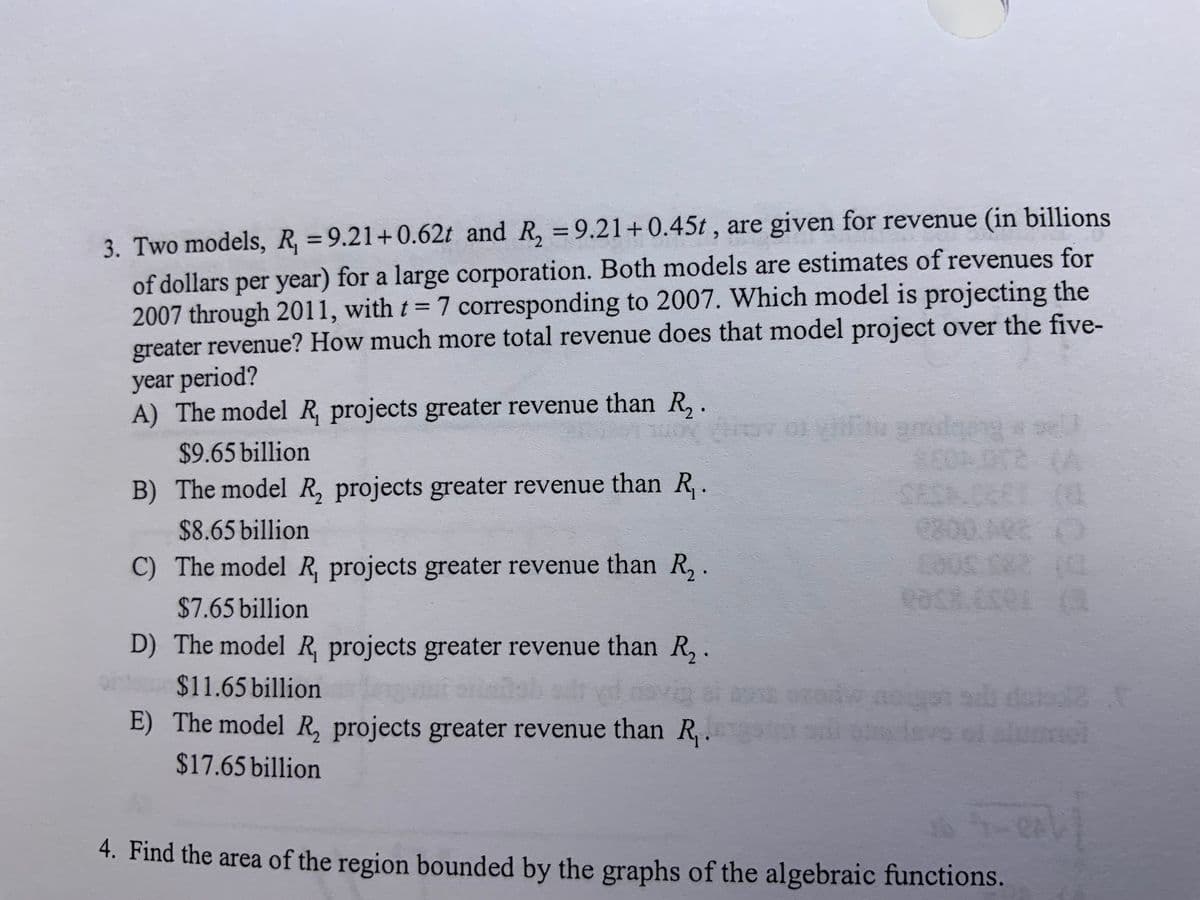
Transcribed Image Text:3. Two models, R, =9.21+0.62t and R, =9.21+0.45t , are given for revenue (in billions
of dollars per year) for a large corporation. Both models are estimates of revenues for
2007 through 2011, with t= 7 corresponding to 2007. Which model is projecting the
greater revenue? How much more total revenue does that model project over the five-
year period?
A) The model R projects greater revenue than R, .
$9.65 billion
(A
SES
0800.M
02
B) The model R, projects greater revenue than R,.
$8.65 billion
C) The model R projects greater revenue than R, .
$7.65 billion
D) The model R, projects greater revenue than R, .
$11.65 billion
E) The model R, projects greater revenue than R,.
$17.65 billion
CA
4. Find the area of the region bounded by the graphs of the algebraic functions.
Expert Solution
This question has been solved!
Explore an expertly crafted, step-by-step solution for a thorough understanding of key concepts.

Step by step
Solved in 2 steps

Knowledge Booster


Learn more about
Need a deep-dive on the concept behind this application? Look no further. Learn more about this topic, economics and related others by exploring similar questions and additional content below.Recommended textbooks for you

Managerial Economics: Applications, Strategies an…
Economics
ISBN:
9781305506381
Author:
James R. McGuigan, R. Charles Moyer, Frederick H.deB. Harris
Publisher:
Cengage Learning
Managerial Economics: Applications, Strategies an…
Economics
ISBN:
9781305506381
Author:
James R. McGuigan, R. Charles Moyer, Frederick H.deB. Harris
Publisher:
Cengage Learning