Two normally distribute pop are for their variances. The alternative hypothesis is that Population 1 has the larger variance. A sample of 13 independent observations are drawn from Population 1 and a separate random sample of nine independent observations are made of Population 2. Sample 1 shows that S = 141, and Sample 2 shows S2 = 123. What can one conclude about the variances of the two populations? LI 22. Suppose that independent random samples each consisting of 16 cases were drawn at random
Two normally distribute pop are for their variances. The alternative hypothesis is that Population 1 has the larger variance. A sample of 13 independent observations are drawn from Population 1 and a separate random sample of nine independent observations are made of Population 2. Sample 1 shows that S = 141, and Sample 2 shows S2 = 123. What can one conclude about the variances of the two populations? LI 22. Suppose that independent random samples each consisting of 16 cases were drawn at random

MATLAB: An Introduction with Applications
6th Edition
ISBN:9781119256830
Author:Amos Gilat
Publisher:Amos Gilat
Chapter1: Starting With Matlab
Section: Chapter Questions
Problem 1P

Related questions
Question
#21 only
Transcribed Image Text:SIA
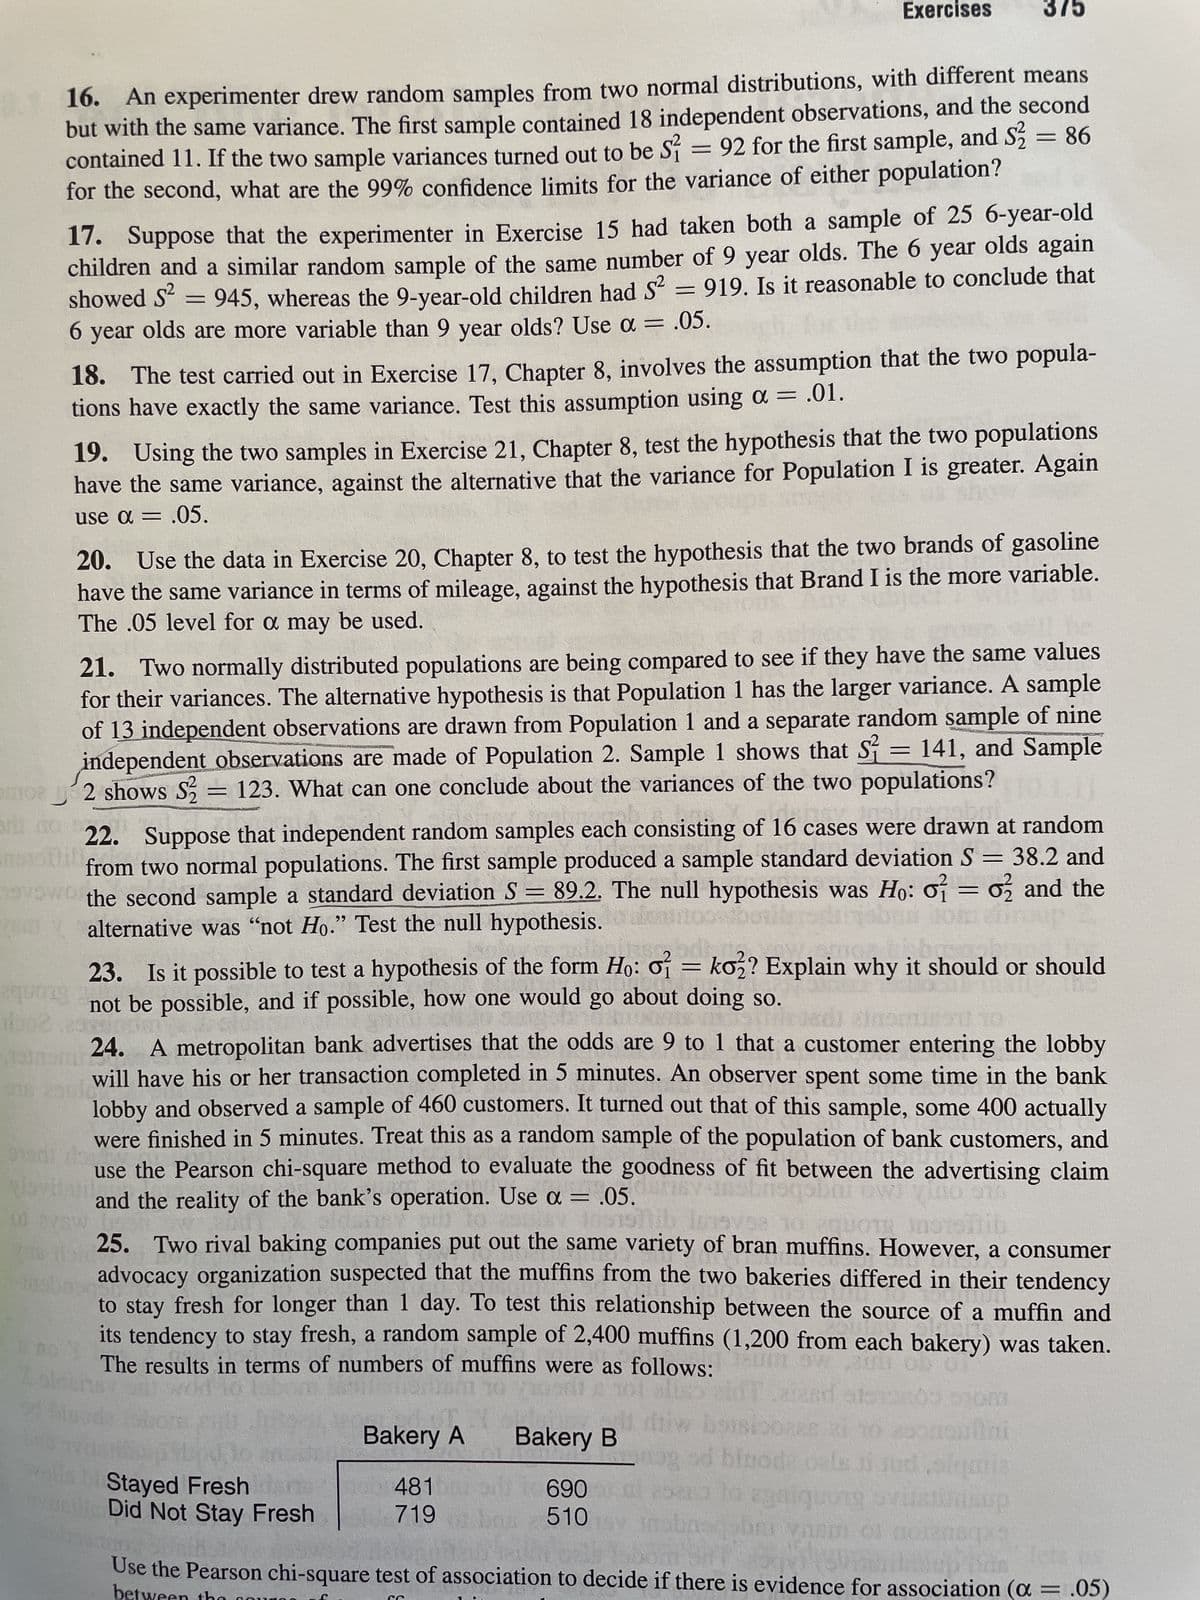
16. An experimenter drew random samples from two normal distributions, with different means
but with the same variance. The first sample contained 18 independent observations, and the second
contained 11. If the two sample variances turned out to be S = 92 for the first sample, and S₂ = 86
for the second, what are the 99% confidence limits for the variance of either population?
QUOIS
Hob2
17. Suppose that the experimenter in Exercise 15 had taken both a sample of 25 6-year-old
children and a similar random sample of the same number of 9 year olds. The 6 year olds again
showed S² = 945, whereas the 9-year-old children had S² = 919. Is it reasonable to conclude that
6 year olds are more variable than 9 year olds? Use α =
= .05.
Exercises
18. The test carried out in Exercise 17, Chapter 8, involves the assumption that the two popula-
tions have exactly the same variance. Test this assumption using a = .01.
19. Using the two samples in Exercise 21, Chapter 8, test the hypothesis that the two populations
have the same variance, against the alternative that the variance for Population I is greater. Again
use α = .05.
21. Two normally distributed populations are being compared to see if they have the same values
for their variances. The alternative hypothesis is that Population 1 has the larger variance. A sample
of 13 independent observations are drawn from Population 1 and a separate random sample of nine
independent observations are made of Population 2. Sample 1 shows that S = 141, and Sample
mor2 shows S2 = 123. What can one conclude about the variances of the two populations?
COMENT
20. Use the data in Exercise 20, Chapter 8, to test the hypothesis that the two brands of gasoline
have the same variance in terms of mileage, against the hypothesis that Brand I is the more variable.
The .05 level for a may be used.
375
22. Suppose that independent random samples each consisting of 16 cases were drawn at random
from two normal populations. The first sample produced a sample standard deviation S = 38.2 and
the second sample a standard deviation S = 89.2. The null hypothesis was Ho: o = o2 and the
alternative was "not Ho." Test the null hypothesis.
tomuffroup
23. Is it possible to test a hypothesis of the form Ho: o = ko2? Explain why it should or should
not be possible, and if possible, how one would go about doing so.
Stayed Fresh
Did Not Stay Fresh
24. A metropolitan bank advertises that the odds are 9 to 1 that a customer entering the lobby
will have his or her transaction completed in 5 minutes. An observer spent some time in the bank
lobby and observed a sample of 460 customers. It turned out that of this sample, some 400 actually
were finished in 5 minutes. Treat this as a random sample of the population of bank customers, and
use the Pearson chi-square method to evaluate the goodness of fit between the advertising claim
and the reality of the bank's operation. Use a = .05.
bar ows vino 910
QUOTE noroitib
CATEY+
0530
won sig
silib
25. Two rival baking companies put out the same variety of bran muffins. However, a consumer
advocacy organization suspected that the muffins from the two bakeries differed in their tendency
to stay fresh for longer than 1 day. To test this relationship between the source of a muffin and
its tendency to stay fresh, a random sample of 2,400 muffins (1,200 from each bakery) was taken.
The results in terms of numbers of muffins were as follows:
Bakery A
481
719
Bakery B
690
510
01
vilni
boisioon
nog od
od bloode oals i jud,pigan?
asana to agaiquorg ustunsup
betwe
Use the Pearson chi-square test of association to decide if there is evidence for association (a
.05)
Expert Solution
This question has been solved!
Explore an expertly crafted, step-by-step solution for a thorough understanding of key concepts.

This is a popular solution!

Trending now
This is a popular solution!

Step by step
Solved in 4 steps with 1 images

Recommended textbooks for you
MATLAB: An Introduction with Applications
Statistics
ISBN:
9781119256830
Author:
Amos Gilat
Publisher:
John Wiley & Sons Inc

Probability and Statistics for Engineering and th…
Statistics
ISBN:
9781305251809
Author:
Jay L. Devore
Publisher:
Cengage Learning

Statistics for The Behavioral Sciences (MindTap C…
Statistics
ISBN:
9781305504912
Author:
Frederick J Gravetter, Larry B. Wallnau
Publisher:
Cengage Learning
MATLAB: An Introduction with Applications
Statistics
ISBN:
9781119256830
Author:
Amos Gilat
Publisher:
John Wiley & Sons Inc
Probability and Statistics for Engineering and th…
Statistics
ISBN:
9781305251809
Author:
Jay L. Devore
Publisher:
Cengage Learning
Statistics for The Behavioral Sciences (MindTap C…
Statistics
ISBN:
9781305504912
Author:
Frederick J Gravetter, Larry B. Wallnau
Publisher:
Cengage Learning

Elementary Statistics: Picturing the World (7th E…
Statistics
ISBN:
9780134683416
Author:
Ron Larson, Betsy Farber
Publisher:
PEARSON

The Basic Practice of Statistics
Statistics
ISBN:
9781319042578
Author:
David S. Moore, William I. Notz, Michael A. Fligner
Publisher:
W. H. Freeman

Introduction to the Practice of Statistics
Statistics
ISBN:
9781319013387
Author:
David S. Moore, George P. McCabe, Bruce A. Craig
Publisher:
W. H. Freeman