type of information provided by these plots. e. Compute the studentized residuals and the R-student residuals for this model. What information is conveyed by these scaled residuals? 4.3 Consider the simple linear regression model fit to the solar energy data in
type of information provided by these plots. e. Compute the studentized residuals and the R-student residuals for this model. What information is conveyed by these scaled residuals? 4.3 Consider the simple linear regression model fit to the solar energy data in

Linear Algebra: A Modern Introduction
4th Edition
ISBN:9781285463247
Author:David Poole
Publisher:David Poole
Chapter7: Distance And Approximation
Section7.3: Least Squares Approximation
Problem 31EQ

Related questions
Question
Kindly answer the question on the second picture using the data in the first picture. Thank you

Transcribed Image Text:type of information provided by these plots.
e. Compute the studentized residuals and the R-student residuals for this
model. What information is conveyed by these scaled residuals?
4.3
Consider the simple linear regression model fit to the solar energy data in
Transcribed Image Text:to Linear Regression Analysis, Fifth Edition. Douglas C. Montgomery, Elizabeth A. Peck,
Vining.
Viley & Sons, Inc. Published 2012 by John Wiley & Sons, Inc.
553
554 APPENDIX B
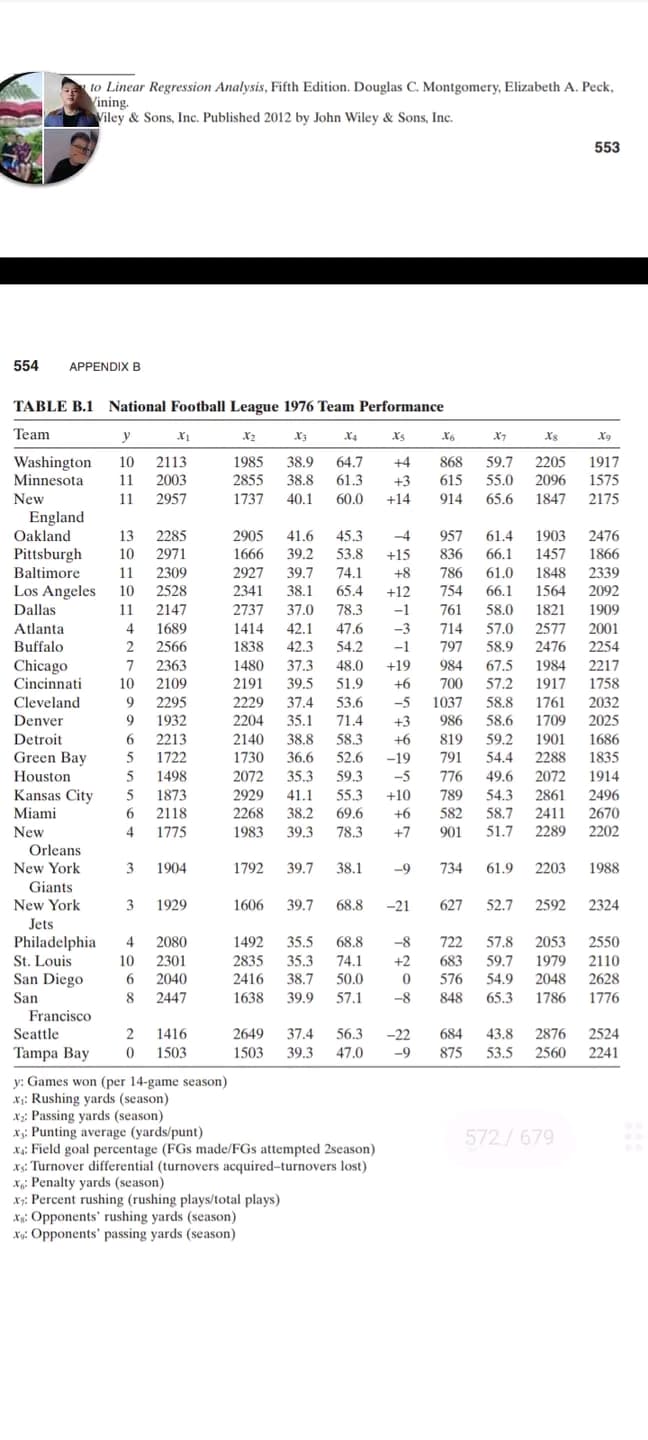
TABLE B.1 National Football League 1976 Team Performance
Team
y
X₂
X₂
X3 X4 X5
X6
X7
Xs
X9
Washington 10 2113
1917
1985 38.9 64.7
2855 38.8 61.3
868 59.7 2205
615 55.0 2096
11 2003
1575
Minnesota
New
11 2957
1737 40.1 60.0 +14
914
65.6 1847
2175
England
Oakland
13 2285
-4 957
61.4
1903
2476
2905 41.6 45.3
1666 39.2 53.8
Pittsburgh
10 2971
+15 836 66.1 1457
1866
Baltimore
11 2309
2927 39.7
74.1
+8 786
61.0 1848
2339
Los Angeles 10 2528
66.1 1564
2092
Dallas
11
2147
2341 38.1 65.4 +12 754
2737 37.0 78.3
1414 42.1
58.0 1821 1909
-1 761
-3 714
Atlanta
4 1689
47.6
57.0
2577
2001
2476 2254
Buffalo
2
2566
-1 797 58.9
1838 42.3 54.2
1480 37.3 48.0
Chicago
7
2363
Cincinnati
10 2109
2191 39.5
51.9
984 67.5 1984 2217
57.2 1917 1758
58.8 1761 2032
1709 2025
Cleveland
9 2295
2229 37.4 53.6
2204 35.1 71.4
Denver
9 1932
Detroit
6 2213
2140 38.8 58.3
59.2 1901 1686
54.4 2288 1835
5
1722
1730
36.6 52.6 -19
5 1498
2072 35.3
59.3 -5
49.6 2072
1914
Green Bay
Houston
Kansas City
Miami
2861
2496
5 1873
6 2118
2929 41.1 55.3 +10
2268 38.2 69.6
1983 39.3 78.3
2411
2670
New
4
1775
2289
2202
Orleans
3 1904
1792
39.7
38.1
734 61.9 2203
1988
3 1929
1606
39.7
68.8
-21 627 52.7 2592
2324
New York
Giants
New York
Jets
Philadelphia
St. Louis
San Diego
San
1492 35.5
68.8
4 2080
10 2301
-8 722 57.8 2053 2550
+2 683 59.7
1979
2110
2835
2416 38.7
1638 39.9 57.1
35.3 74.1
50.0
6 2040
0 576 54.9 2048
2628
8 2447
848
65.3 1786
1776
Francisco
Seattle
Tampa Bay
2 1416
2649 37.4
684 43.8 2876 2524
875 53.5 2560 2241
0 1503
1503 39.3 47.0
y: Games won (per 14-game season)
x₁: Rushing yards (season)
x₂: Passing yards (season)
x: Punting average (yards/punt)
572/679
x₁: Field goal percentage (FGs made/FGs attempted 2season)
xs: Turnover differential (turnovers acquired-turnovers lost)
x: Penalty yards (season)
x: Percent rushing (rushing plays/total plays)
Xs: Opponents' rushing yards (season)
Xo: Opponents' passing yards (season)
|学学学学学学学学学学学早早
+4
+3
+19
+6 700
-5 1037
+3 986 58.6
+6 819
791
776
789 54.3
+6 582 58.7
+7 901 51.7
-9
6 ÷ doot do ÷ 6
56.3 -22
Expert Solution
This question has been solved!
Explore an expertly crafted, step-by-step solution for a thorough understanding of key concepts.

This is a popular solution!

Trending now
This is a popular solution!

Step by step
Solved in 2 steps

Recommended textbooks for you
Linear Algebra: A Modern Introduction
Algebra
ISBN:
9781285463247
Author:
David Poole
Publisher:
Cengage Learning

Glencoe Algebra 1, Student Edition, 9780079039897…
Algebra
ISBN:
9780079039897
Author:
Carter
Publisher:
McGraw Hill

Functions and Change: A Modeling Approach to Coll…
Algebra
ISBN:
9781337111348
Author:
Bruce Crauder, Benny Evans, Alan Noell
Publisher:
Cengage Learning
Linear Algebra: A Modern Introduction
Algebra
ISBN:
9781285463247
Author:
David Poole
Publisher:
Cengage Learning
Glencoe Algebra 1, Student Edition, 9780079039897…
Algebra
ISBN:
9780079039897
Author:
Carter
Publisher:
McGraw Hill
Functions and Change: A Modeling Approach to Coll…
Algebra
ISBN:
9781337111348
Author:
Bruce Crauder, Benny Evans, Alan Noell
Publisher:
Cengage Learning

College Algebra
Algebra
ISBN:
9781305115545
Author:
James Stewart, Lothar Redlin, Saleem Watson
Publisher:
Cengage Learning