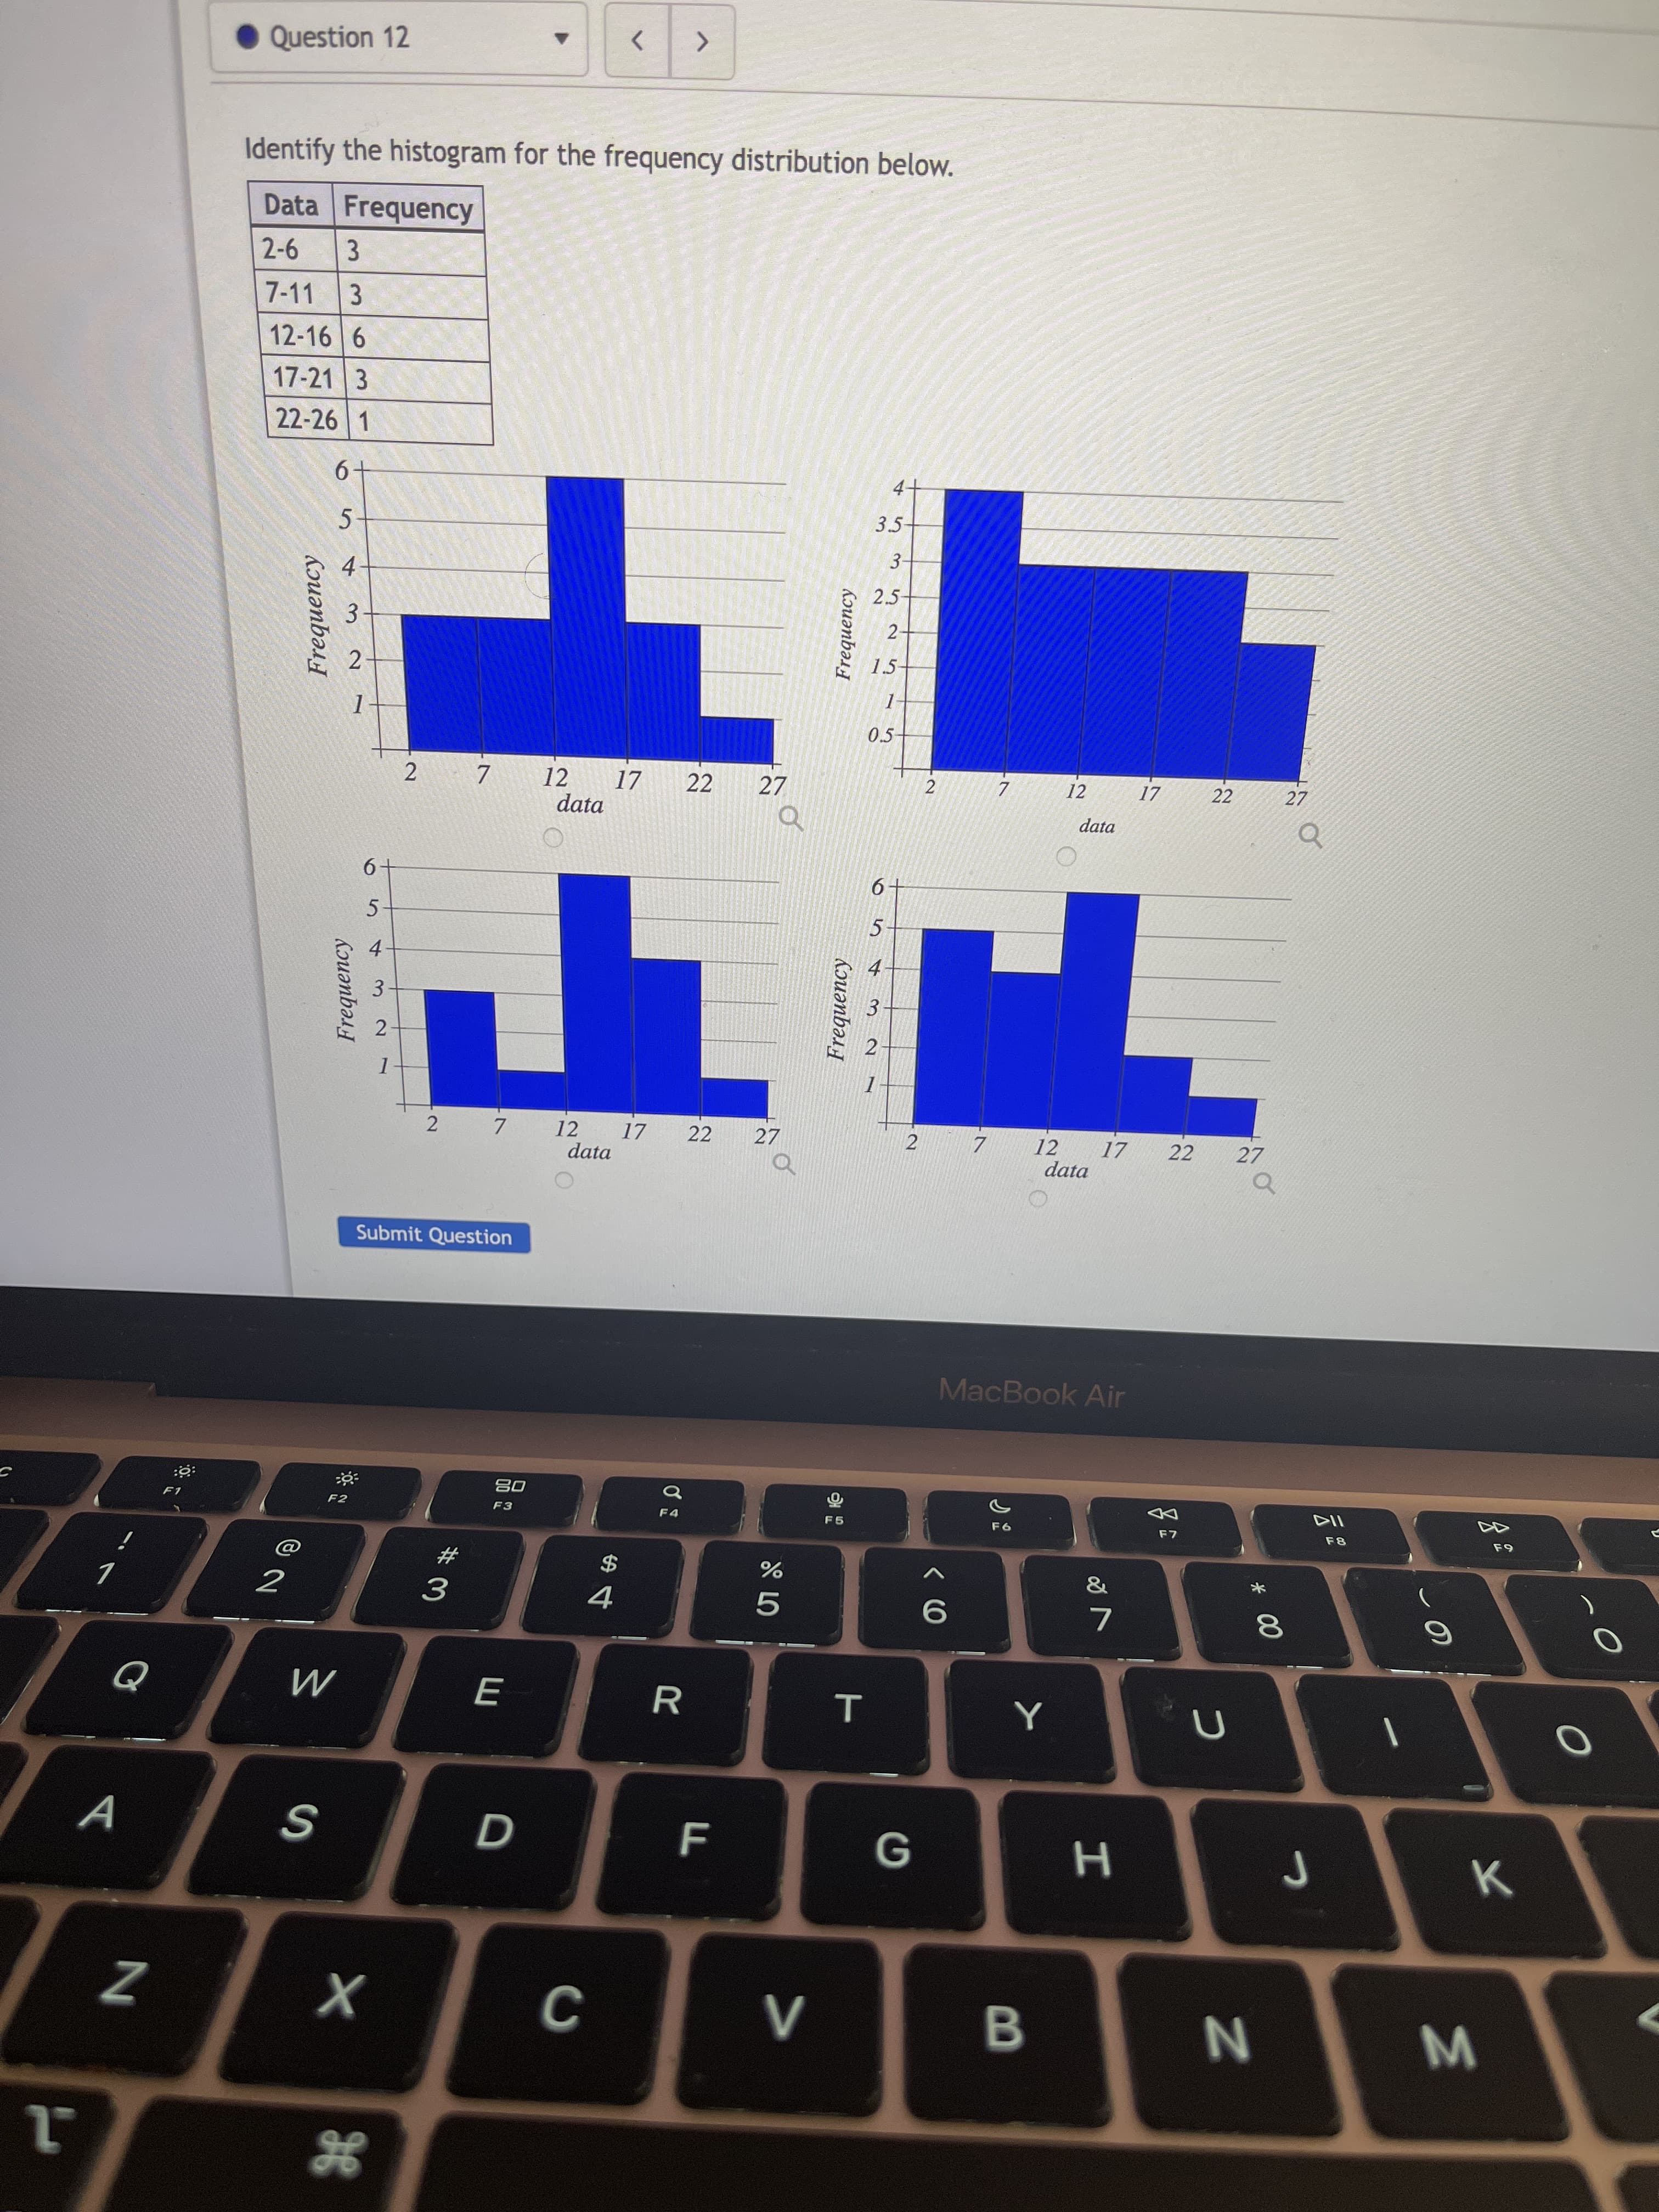
uestion 12 Identify the histogram for the frequency distribution below. Data Frequency 2-6 7-11 12-16 6 17-21 3


Q: Stem-and-leaf of Data: Amount of Money earned in a day in dollars Leaf Unit = 10 N = 59 3. 234 13 3.…
A: Stem-Leaf: Stem and Leaf plot is similar to histogram Stem and Leaf is another way of representing…
Q: Birth Weights Based on Data Set 4 “Births” in Appendix B, birth weights are normally distributed…
A: a. Area under the curve for a bell-shaped graph: The birth weights follow a normal distribution with…
Q: The frequency distribution below represents frequencies of actual low temperatures recorded during…
A: Given :
Q: The frequency distribution below represents frequencies of actual low temperatures Choose the…
A: Consider the following table:-
Q: Question Help Y Deep mixing is a ground improvement method developed for soft soils like clay, silt,…
A: The Z-score of a random variable X is defined as follows: Z = (X – µ)/σ. Here, µ and σ are the mean…
Q: Distribution A: Sample Mean Median 90.176 96.54 Sample Skewness -0.51126938 Histogram 25 21 20 15 15…
A: Here , Mean = 90.176 Median = 96.54
Q: Deviation boundary% of data points within boundary Probability of any particular data point being…
A: The probability that a random variable X lies in the interval is given below:…
Q: Sample statistics for annual earning: High school diploma Bachelor's degree or higher X1= $27,136…
A: Solution: d. Null hypothesis: That is, there is no difference in the mean annual earnings based on…
Q: Stem-and-leaf of Data: Amount of Money earned in a day in dollars Leaf Unit 10 N = %3D 2 2 59 3 234…
A: Since you have posted a question with multiple sub-parts, we will solve first three subparts for…
Q: median and mode, Q1, Q3, De and Ps of the fo grouped data. 1. Weight of 50 women in a fitness club…
A: Mean is the average value around which the whole data set is concentrated. For the grouped frequency…
Q: Q1. Sketch a histogram to represent this data table. Q2. Label the x- & y-axis with both words and…
A:
Q: Stem-and-leaf of Data: Amount of Money earned in a day in dollars Leaf Unit = 10 N = * 2 2 59 5 3…
A: The rule of thumb seems to be: If the skewness is between -0.5 and 0.5, the data are fairly…
Q: Value Frequency 3 Find the mean of the estimated miles per gallon of the automobiles in the table to…
A: Solution
Q: i. ii. iii. Find the class mark of each class. Calculate the less than cumulative frequency…
A: Hi there! Thank you for posting the question. As there are multiple sub parts, according to our…
Q: Euestion Help Examine the normal quantile plot and determine whether it depicts sample data from a…
A: As we know that- The condition for sample data is from the normal population is all points should be…
Q: Frequency Histogram of January Air Temperatures at YVR (1970-2019) 20 18 16 14 12 10 8 4 2 [-0.4,…
A:
Q: Distribution B: Sample Mean Median 55.68893333 49.95 Sample Skewness 0.616181861 Histogram 25 21 20…
A: Histogram : A histogram is the most commonly used graph to show frequency distributions. It looks…
Q: Arsenic in Rice Listed below are measured amounts ( μ g per serving) of arsenic in a sample of…
A: The data is based on the amount of arsenic in the sample of brown rice. The class width is 2µg and…
Q: A measure of how scores scatter around the center of a distribution A)Variance B)Standard deviation…
A: Variance, Standard deviation and Range all tells us about how scores are scatter around the center…
Q: Statistics students believe that the mean score on a first statistics test is 65. The instructor…
A: given information : grades are normally distributed . α=5% A) the claim is instructor thinks that…
Q: Age (years) Frequency 20≤x<30 160 30≤x<40 130 40≤x<50 100 50≤x<60 115 60≤x<70 125 70≤x<80 135 The…
A: (a) Construct the Histogram for the distribution of ages. From the information, given that Use…
Q: II. Frequency Distribution Table. Solve the mean and complete the table below. Class Frequency…
A: The distribution table is given with frequencies.
Q: The frequency distribution below represents frequencies of actual low temperatures recorded during…
A: Given Number of frequencies n=7
Q: The relative frequency histogram represents the length of phone calls on George's cell phone during…
A: Relative frequency is decreasing when the length of phone call is increasing and the curve is right…
Q: grade point averages (GPA) for 12 randomly selected college students are shown on the right.…
A: Given: The data shows the grade point averages (GPA) for 12 randomly selected college students.
Q: Question Help The data represents the daily rainfall (in inches) for one month. Construct a…
A: We have to find frequency table
Q: ccompanying data table lists leading digits of 317 inter-arrival Internet traffic times for a…
A: a) Null and alternative hypotheisis Ho: Leading digits of inter-arrival internet traffic follow…
Q: Activ stical Directions: Using the following data, moadify the tabular representation by following…
A: Relative frequency is calculated by rf = frequency/total frequency = frequency/400 for each student…
Q: Temperature ( F) 45-49 50-54 55-59 Does the frequency distribution appear to have a normal…
A: Given that Frequency distribution of temperature. We know that Normal distribution graphs are…
Q: Requirements A researcher collects a simple random sample of grade-point averages of statistics…
A:
Q: a. Construct a frequency distribution table. b. Sketch a histogram showing the distribution. c.…
A: Given data 8 6 7 5 4 10 8 9 5 7 2 9 9 10 7 8 8 7 4 6 3 8 9 6
Q: Part 1 (a) Find the sample mean. x=2.28 2.28 (Round to two decimal places as needed.) Part 2…
A: Given data : 2.1 3.1 2.6 1.9 0.8 4.0 2.4 1.1 3.5 0.1 2.5…
Q: OUESTION 4 Find the class limits of the first class of a distribution with the given histogram. 13.5…
A: The class limits are found asLower class limit=Lower class boundary+0.5Upper class limit=Upper class…
Q: Speeds of automobiles on a certain stretch of freeway at 11:00 PM are normally distributed with mean…
A: The normal distribution: A continuous random variable X is said to follow normal distribution with…
Q: Data set “Cola weights and Volumes” Includes Volumes” includes volumes (ounces) of a simple random…
A: From the given information, let X be the volume of cans of Coke. n = 26, x-bar = 12.19 oz and s =…
Q: MEASURES OF CENTRAL TENDENDCY (GROUPED DATA OUTPUT) Complete the frequency distribution table below.…
A:
Q: Stem-and-leaf of Data: Amount of Money earned in a day in dollars Leaf Unit = 10 N = 59 3 234 13 3…
A: Note: Hi there! Thank you for posting the question. As there are multiple sub parts, according to…
Q: Stem-and-leaf of Data: Amount of Money earned in a day in dollars Leaf Unit = 10 N = 34 2…
A: The rule of thumb seems to be: If the skewness is between -0.5 and 0.5, the data are fairly…
Q: mplete the grouped frequency distribution for data. (Note that the class width is 6.) (b) Construct…
A: Data in non descending order 2 3 4 5 6 7 8 8 9 10 11 11 11 12 13…
Q: The given table shows the grades distribution of 40 students in one class after an exam. Number of…
A:
Q: a. Summarize the data using the Descriptive Statistics tool. What can you say about the shape of the…
A: Mean-143 Standard Error-4.437 Median-119 Mode-80 Standard Deviation-133.12 Sample Variance-17720.87…
Q: estion Let X follows normal distribution with mean and variance o², find P(|X− µ|<20). a) b) c) d)…
A: Given that X follows normal distribution with mean µ and variance σ2 It is asked to find PX-μ<2σ…
Q: City Temp. on February 21 Average Temp. in February Std. Deviation z-score Montreal 3.4 -7.7 2.7…
A:
Q: Consider the discrete data in the table below. a) Construct a frequency distribution. ) Construct a…
A: Data Frequency 1 4 2 5 3 8 4 3 5 4
Q: Mean Devia 4 Example 9. Find the Median and Mean Deviation of the following data. Also calculate…
A:
Q: Grade Relative Cumulative Frequency Distribution Frequency Frequency A 19.35% В 8 25.81% C 7 22.58%…
A: The cumulative frequency is calculated by adding all of the previous relative frequencies to the…
Q: Airfares were based on the total ticket value, which consisted of the price charged by the airlines…
A: The required normal curve can be obtained in excel by following the below step-by-step explanation…
Q: Top quality 15% of the production is good quality, the worst 15% is bad quality, the rest are medium…
A: Top quality 15% of the production is good quality, the worst 15% is bad quality, the rest 70% are…
Q: Directions. Locate the following percentiles under the normal curve. Sketch its figure on the normal…
A: We need to use the knowledge of Normal curves to find Percentile values.

Step by step
Solved in 2 steps
