Sample statistics for annual earning: High school diploma Bachelor's degree or higher X1= $27,136 X2= $34,329 %3D S1 = $2318 S2 = $4962 %3D n1 = 15 %3D n2 = 12 %3D The annual earnings of 15 people with a high school diploma and 12 people with a bachelor's degree or higher are shown above. Can you conclude that there is a difference in the mean annual earnings based on level of education? Use a = 0.01. Assume the populations are normally distributed and the population variances are not equal. a. Identify the claim and state Ho and Ha b. Identify the level of significance a and the degrees of freedom. c. Find the critical values and identify the rejection regions. d. Find the standardized test statistic t. Sketch a graph. e. Decide whether to reject the null hypothesis. f. Interpret the decision in the context of the original claim.
Sample statistics for annual earning: High school diploma Bachelor's degree or higher X1= $27,136 X2= $34,329 %3D S1 = $2318 S2 = $4962 %3D n1 = 15 %3D n2 = 12 %3D The annual earnings of 15 people with a high school diploma and 12 people with a bachelor's degree or higher are shown above. Can you conclude that there is a difference in the mean annual earnings based on level of education? Use a = 0.01. Assume the populations are normally distributed and the population variances are not equal. a. Identify the claim and state Ho and Ha b. Identify the level of significance a and the degrees of freedom. c. Find the critical values and identify the rejection regions. d. Find the standardized test statistic t. Sketch a graph. e. Decide whether to reject the null hypothesis. f. Interpret the decision in the context of the original claim.

Glencoe Algebra 1, Student Edition, 9780079039897, 0079039898, 2018
18th Edition
ISBN:9780079039897
Author:Carter
Publisher:Carter
Chapter10: Statistics
Section10.3: Measures Of Spread
Problem 1GP

Related questions
Topic Video
Question
D, E, F
detailed calculations and explanations please.
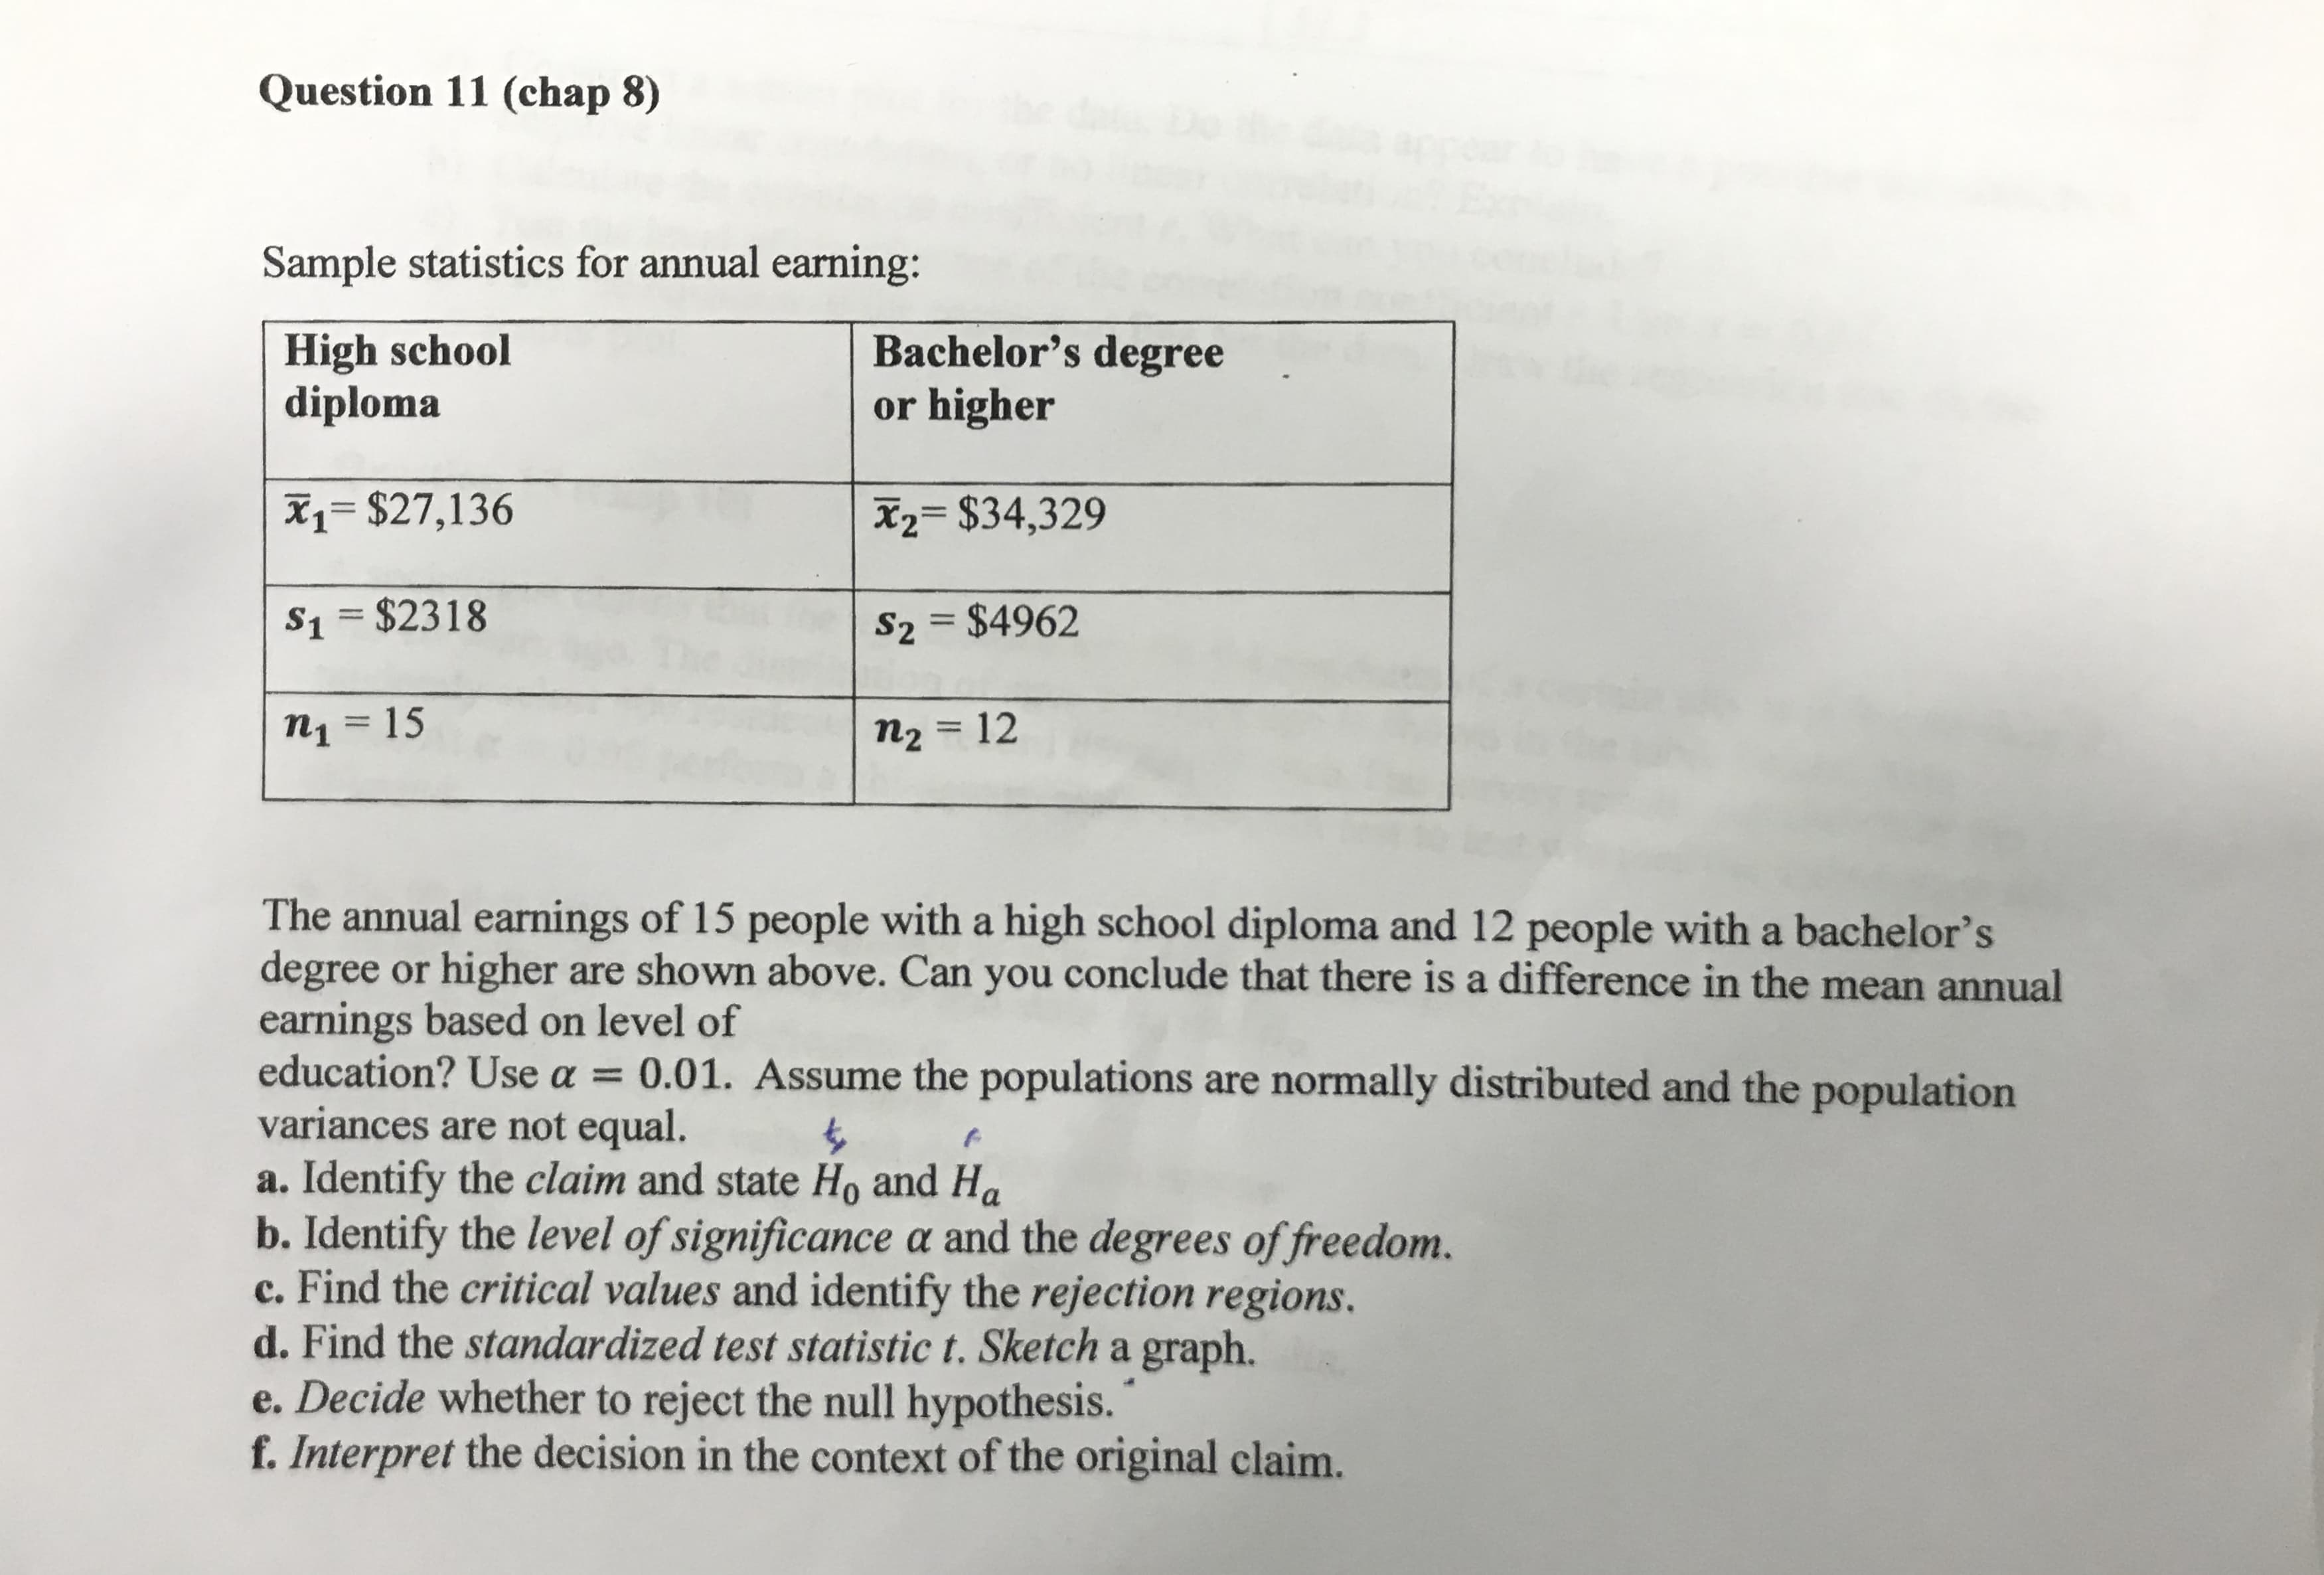
Transcribed Image Text:Sample statistics for annual earning:
High school
diploma
Bachelor's degree
or higher
X1= $27,136
X2= $34,329
%3D
S1 = $2318
S2 = $4962
%3D
n1 = 15
%3D
n2 = 12
%3D
The annual earnings of 15 people with a high school diploma and 12 people with a bachelor's
degree or higher are shown above. Can you conclude that there is a difference in the mean annual
earnings based on level of
education? Use a = 0.01. Assume the populations are normally distributed and the population
variances are not equal.
a. Identify the claim and state Ho and Ha
b. Identify the level of significance a and the degrees of freedom.
c. Find the critical values and identify the rejection regions.
d. Find the standardized test statistic t. Sketch a graph.
e. Decide whether to reject the null hypothesis.
f. Interpret the decision in the context of the original claim.
Expert Solution
This question has been solved!
Explore an expertly crafted, step-by-step solution for a thorough understanding of key concepts.

Step by step
Solved in 2 steps with 6 images

Knowledge Booster


Learn more about
Need a deep-dive on the concept behind this application? Look no further. Learn more about this topic, statistics and related others by exploring similar questions and additional content below.Recommended textbooks for you
Glencoe Algebra 1, Student Edition, 9780079039897…
Algebra
ISBN:
9780079039897
Author:
Carter
Publisher:
McGraw Hill

College Algebra (MindTap Course List)
Algebra
ISBN:
9781305652231
Author:
R. David Gustafson, Jeff Hughes
Publisher:
Cengage Learning
Glencoe Algebra 1, Student Edition, 9780079039897…
Algebra
ISBN:
9780079039897
Author:
Carter
Publisher:
McGraw Hill
College Algebra (MindTap Course List)
Algebra
ISBN:
9781305652231
Author:
R. David Gustafson, Jeff Hughes
Publisher:
Cengage Learning