ught and installed fuel filters on my family's five cars that are supposed age. I thought l'd put them to the test-we recorded the fuel consumpti ch of road for each car (in miles-per-gallon). Here is a summary, with da che variance of each row: Car A Car B Car C Car D Car E bout Eiltor 21 5 17 2 21 0
ught and installed fuel filters on my family's five cars that are supposed age. I thought l'd put them to the test-we recorded the fuel consumpti ch of road for each car (in miles-per-gallon). Here is a summary, with da che variance of each row: Car A Car B Car C Car D Car E bout Eiltor 21 5 17 2 21 0

Glencoe Algebra 1, Student Edition, 9780079039897, 0079039898, 2018
18th Edition
ISBN:9780079039897
Author:Carter
Publisher:Carter
Chapter10: Statistics
Section10.5: Comparing Sets Of Data
Problem 14PPS

Related questions
Question
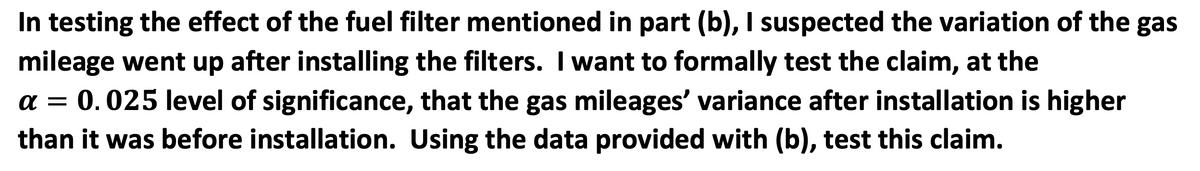
Transcribed Image Text:In testing the effect of the fuel filter mentioned in part (b), I suspected the variation of the gas
mileage went up after installing the filters. I want to formally test the claim, at the
a = 0.025 level of significance, that the gas mileages' variance after installation is higher
than it was before installation. Using the data provided with (b), test this claim.
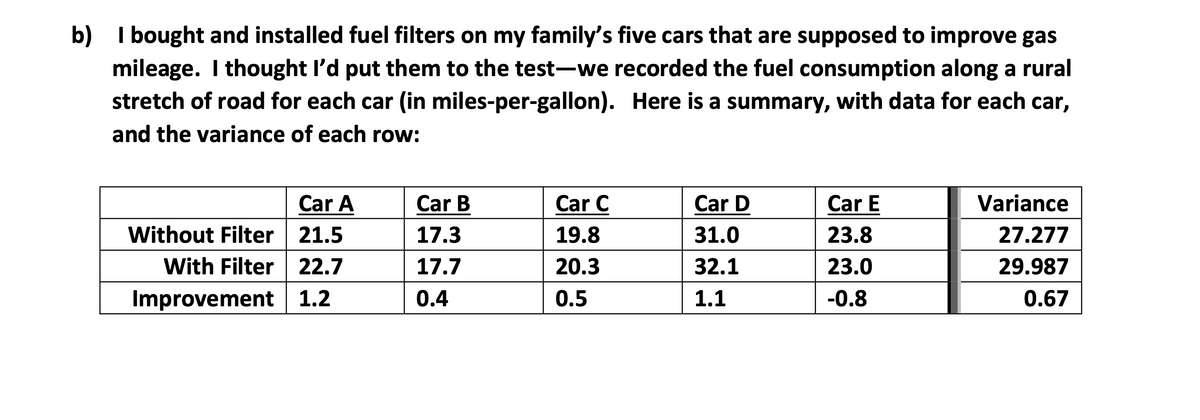
Transcribed Image Text:b) I bought and installed fuel filters on my family's five cars that are supposed to improve gas
mileage. I thought l'd put them to the test-we recorded the fuel consumption along a rural
stretch of road for each car (in miles-per-gallon). Here is a summary, with data for each car,
and the variance of each row:
Car A
Without Filter 21.5
With Filter 22.7
Improvement 1.2
Car B
Car C
Car D
Car E
Variance
17.3
19.8
31.0
23.8
27.277
17.7
20.3
32.1
23.0
29.987
0.4
0.5
1.1
-0.8
0.67
Expert Solution
This question has been solved!
Explore an expertly crafted, step-by-step solution for a thorough understanding of key concepts.

Step by step
Solved in 5 steps

Knowledge Booster


Learn more about
Need a deep-dive on the concept behind this application? Look no further. Learn more about this topic, statistics and related others by exploring similar questions and additional content below.Recommended textbooks for you
Glencoe Algebra 1, Student Edition, 9780079039897…
Algebra
ISBN:
9780079039897
Author:
Carter
Publisher:
McGraw Hill
Glencoe Algebra 1, Student Edition, 9780079039897…
Algebra
ISBN:
9780079039897
Author:
Carter
Publisher:
McGraw Hill