
Glencoe Algebra 1, Student Edition, 9780079039897, 0079039898, 2018
18th Edition
ISBN:9780079039897
Author:Carter
Publisher:Carter
Chapter10: Statistics
Section10.5: Comparing Sets Of Data
Problem 11PPS

Related questions
Question
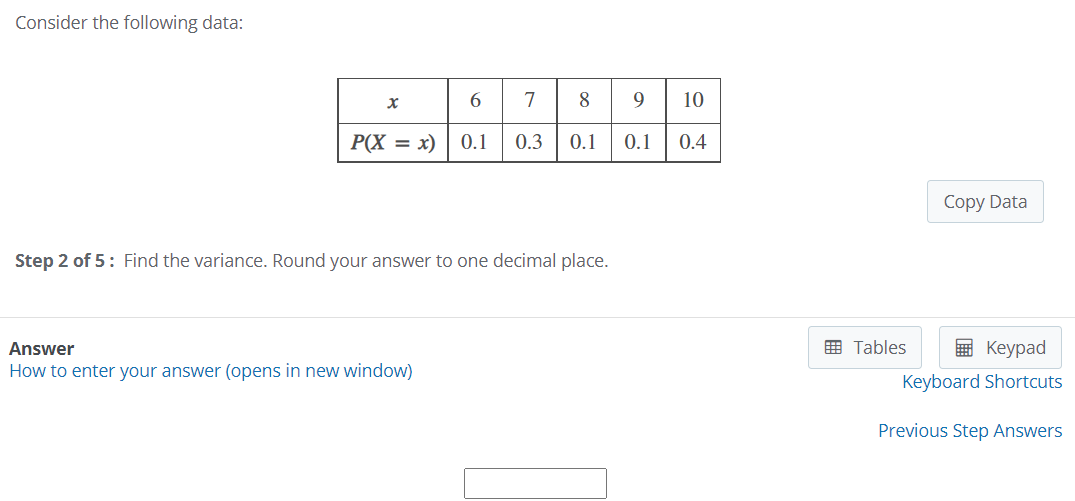
Transcribed Image Text:Consider the following data:
78 9
10
P(X = x)
0.1
0.3
0.1
0.1
0.4
Copy Data
Step 2 of 5: Find the variance. Round your answer to one decimal place.
Answer
画 Tables
E Keypad
How to enter your answer (opens in new window)
Keyboard Shortcuts
Previous Step Answers
Expert Solution
This question has been solved!
Explore an expertly crafted, step-by-step solution for a thorough understanding of key concepts.

This is a popular solution!

Trending now
This is a popular solution!

Step by step
Solved in 2 steps with 2 images

Recommended textbooks for you
Glencoe Algebra 1, Student Edition, 9780079039897…
Algebra
ISBN:
9780079039897
Author:
Carter
Publisher:
McGraw Hill
Glencoe Algebra 1, Student Edition, 9780079039897…
Algebra
ISBN:
9780079039897
Author:
Carter
Publisher:
McGraw Hill