Understanding: Check Your 1. The following graph was displayed by a national news organization. Explain why the graph may be misleading, and sketch a corrected version of the graph. SOUTHWEST BORDER APPREHENSION: OCTOBER - APRIL 185,000 175,000 165.000 155,000 165,244 2011 170,223 2012 192,298 2013
Understanding: Check Your 1. The following graph was displayed by a national news organization. Explain why the graph may be misleading, and sketch a corrected version of the graph. SOUTHWEST BORDER APPREHENSION: OCTOBER - APRIL 185,000 175,000 165.000 155,000 165,244 2011 170,223 2012 192,298 2013

Glencoe Algebra 1, Student Edition, 9780079039897, 0079039898, 2018
18th Edition
ISBN:9780079039897
Author:Carter
Publisher:Carter
Chapter1: Expressions And Functions
Section1.6: Relations
Problem 45PFA

Related questions
Question
Show work
Transcribed Image Text:Check Your
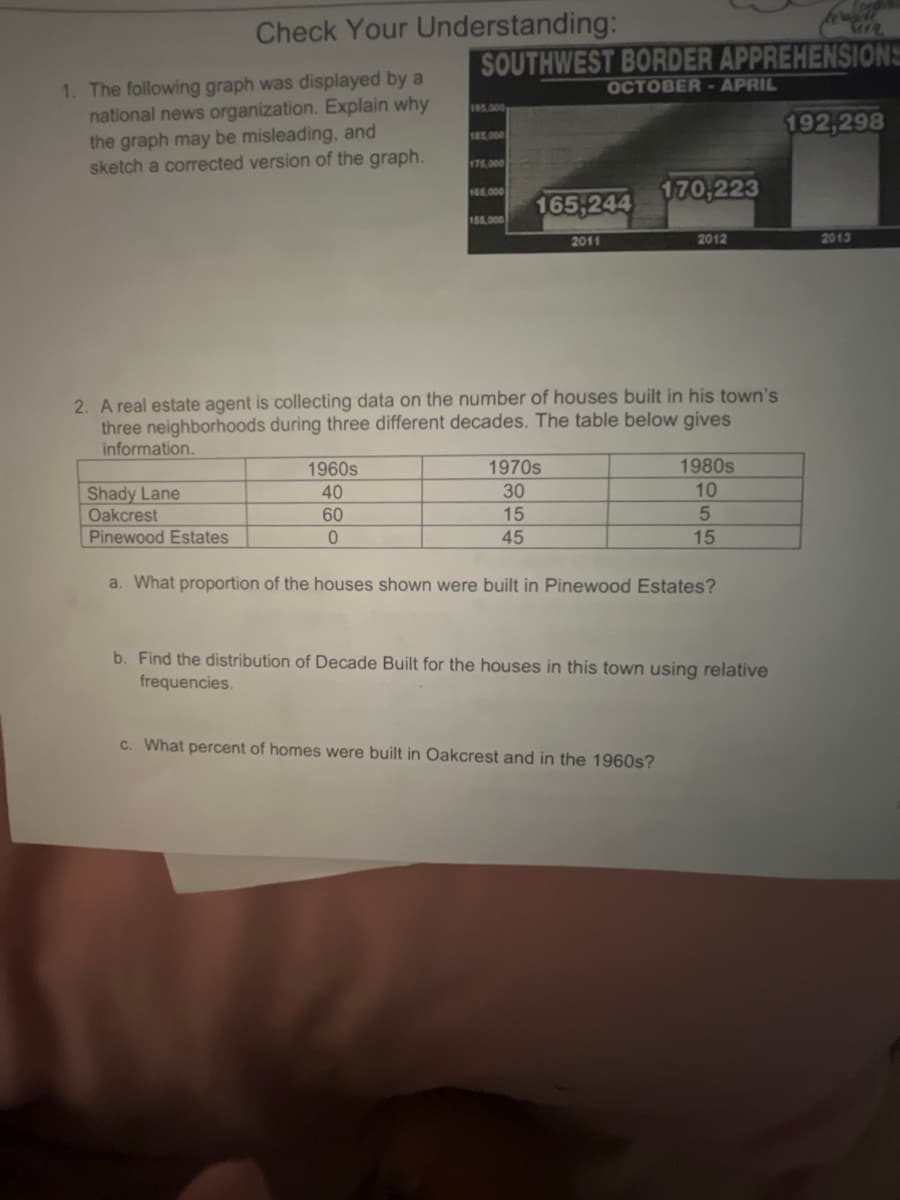
1. The following graph was displayed by a
national news organization. Explain why
the graph may be misleading, and
sketch a corrected version of the graph.
Understanding:
Shady Lane
Oakcrest
Pinewood Estates
1960s
40
60
0
SOUTHWEST BORDER APPREHENSIONS
OCTOBER - APRIL
195,000
185,000
175,000
165.000
155,000
165,244
2011
2. A real estate agent is collecting data on the number of houses built in his town's
three neighborhoods during three different decades. The table below gives
information.
1970s
30
15
45
170,223
2012
c. What percent of homes were built in Oakcrest and in the 1960s?
1980s
10
5
15
a. What proportion of the houses shown were built in Pinewood Estates?
b. Find the distribution of Decade Built for the houses in this town using relative
frequencies.
Gra
192,298
2013
Expert Solution
This question has been solved!
Explore an expertly crafted, step-by-step solution for a thorough understanding of key concepts.

This is a popular solution!

Trending now
This is a popular solution!

Step by step
Solved in 2 steps with 1 images

Recommended textbooks for you
Glencoe Algebra 1, Student Edition, 9780079039897…
Algebra
ISBN:
9780079039897
Author:
Carter
Publisher:
McGraw Hill

Algebra: Structure And Method, Book 1
Algebra
ISBN:
9780395977224
Author:
Richard G. Brown, Mary P. Dolciani, Robert H. Sorgenfrey, William L. Cole
Publisher:
McDougal Littell

Big Ideas Math A Bridge To Success Algebra 1: Stu…
Algebra
ISBN:
9781680331141
Author:
HOUGHTON MIFFLIN HARCOURT
Publisher:
Houghton Mifflin Harcourt
Glencoe Algebra 1, Student Edition, 9780079039897…
Algebra
ISBN:
9780079039897
Author:
Carter
Publisher:
McGraw Hill
Algebra: Structure And Method, Book 1
Algebra
ISBN:
9780395977224
Author:
Richard G. Brown, Mary P. Dolciani, Robert H. Sorgenfrey, William L. Cole
Publisher:
McDougal Littell
Big Ideas Math A Bridge To Success Algebra 1: Stu…
Algebra
ISBN:
9781680331141
Author:
HOUGHTON MIFFLIN HARCOURT
Publisher:
Houghton Mifflin Harcourt

College Algebra (MindTap Course List)
Algebra
ISBN:
9781305652231
Author:
R. David Gustafson, Jeff Hughes
Publisher:
Cengage Learning