Understanding student demographics is important for a college in deciding what programs will most benefit students. A sample of students is taken to determine what proportion of students identify as Hispanic or Latino. The results of the sample are shown.below. Student sample Hispanic/Latino (x) 63 Sample size (n) 350 Confidence Level 90% Critical Value 1.645 Margin of Error 0.034 What is the population parameter? Pick What is the point estimate for the population proportion? p = Ex: 0.99 The data suggests a Pick confidence exists that the proportion of students who identify as Hispanic or Latino is between Ex: 0.123 Check Try again
Understanding student demographics is important for a college in deciding what programs will most benefit students. A sample of students is taken to determine what proportion of students identify as Hispanic or Latino. The results of the sample are shown.below. Student sample Hispanic/Latino (x) 63 Sample size (n) 350 Confidence Level 90% Critical Value 1.645 Margin of Error 0.034 What is the population parameter? Pick What is the point estimate for the population proportion? p = Ex: 0.99 The data suggests a Pick confidence exists that the proportion of students who identify as Hispanic or Latino is between Ex: 0.123 Check Try again

MATLAB: An Introduction with Applications
6th Edition
ISBN:9781119256830
Author:Amos Gilat
Publisher:Amos Gilat
Chapter1: Starting With Matlab
Section: Chapter Questions
Problem 1P

Related questions
Question
Transcribed Image Text:book/QNT 375T_55007971/chapter/5/section/3
375T: Business Data Analytics home >
tervals for population proportions
E zyBooks catalog
Jump to level 1
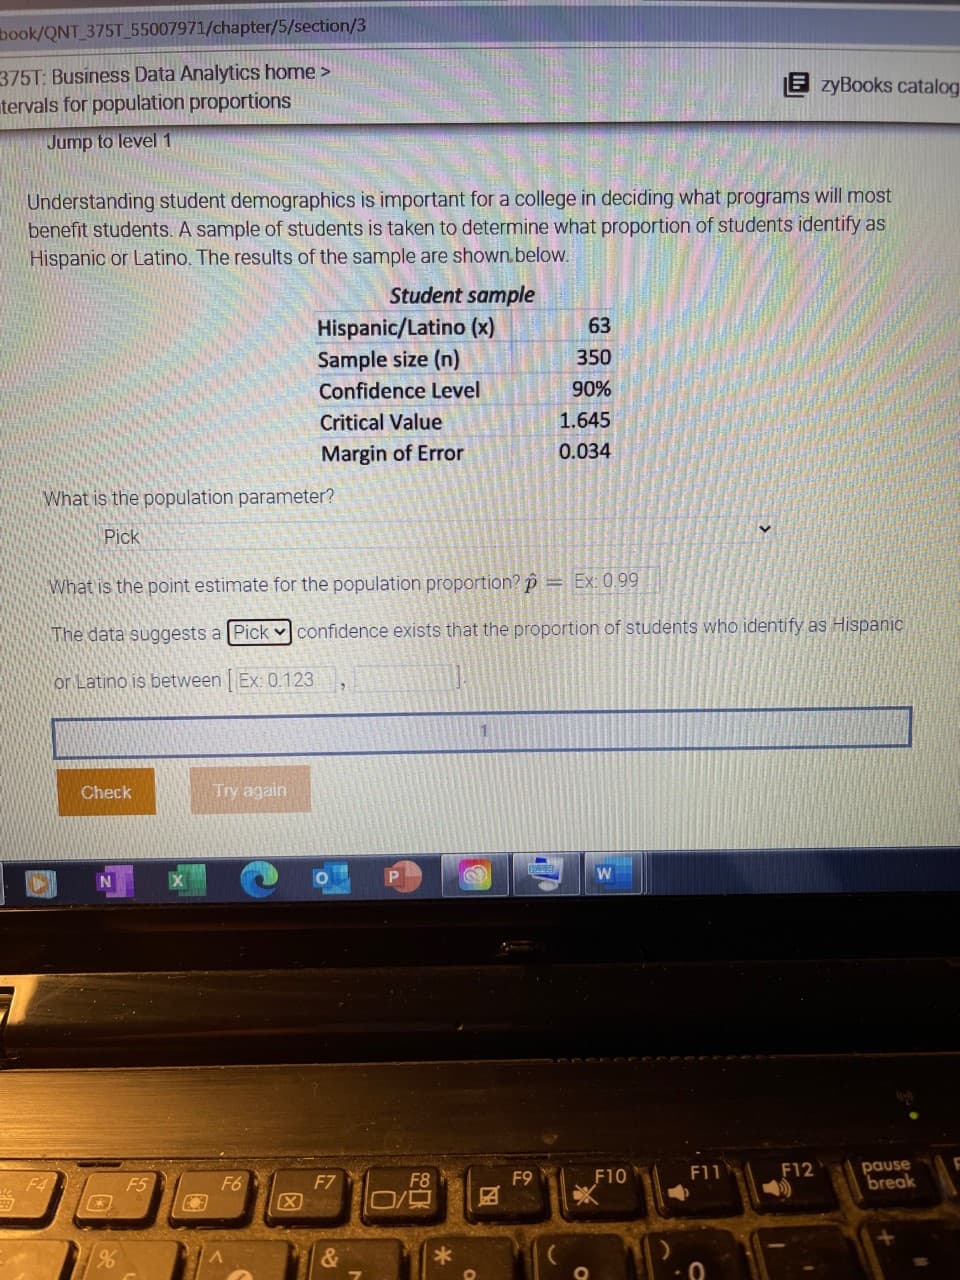
Understanding student demographics is important for a college in deciding what programs will most
benefit students. A sample of students is taken to determine what proportion of students identify as
Hispanic or Latino. The results of the sample are shown. below.
Student sample
Hispanic/Latino (x)
Sample size (n)
63
350
Confidence Level
90%
Critical Value
1.645
Margin of Error
0.034
What is the population parameter?
Pick
What is the point estimate for the population proportion? p = Ex: 0.99
The data suggests a Pick vconfidence exists that the proportion of students who identify as Hispanic
or Latino is between | Ex: 0.123
Check
Try again
W
pause
break
F8
F9
F10
F11
F12
F4
F6
F7
Expert Solution
This question has been solved!
Explore an expertly crafted, step-by-step solution for a thorough understanding of key concepts.

This is a popular solution!

Trending now
This is a popular solution!

Step by step
Solved in 4 steps

Recommended textbooks for you
MATLAB: An Introduction with Applications
Statistics
ISBN:
9781119256830
Author:
Amos Gilat
Publisher:
John Wiley & Sons Inc

Probability and Statistics for Engineering and th…
Statistics
ISBN:
9781305251809
Author:
Jay L. Devore
Publisher:
Cengage Learning

Statistics for The Behavioral Sciences (MindTap C…
Statistics
ISBN:
9781305504912
Author:
Frederick J Gravetter, Larry B. Wallnau
Publisher:
Cengage Learning
MATLAB: An Introduction with Applications
Statistics
ISBN:
9781119256830
Author:
Amos Gilat
Publisher:
John Wiley & Sons Inc
Probability and Statistics for Engineering and th…
Statistics
ISBN:
9781305251809
Author:
Jay L. Devore
Publisher:
Cengage Learning
Statistics for The Behavioral Sciences (MindTap C…
Statistics
ISBN:
9781305504912
Author:
Frederick J Gravetter, Larry B. Wallnau
Publisher:
Cengage Learning

Elementary Statistics: Picturing the World (7th E…
Statistics
ISBN:
9780134683416
Author:
Ron Larson, Betsy Farber
Publisher:
PEARSON

The Basic Practice of Statistics
Statistics
ISBN:
9781319042578
Author:
David S. Moore, William I. Notz, Michael A. Fligner
Publisher:
W. H. Freeman

Introduction to the Practice of Statistics
Statistics
ISBN:
9781319013387
Author:
David S. Moore, George P. McCabe, Bruce A. Craig
Publisher:
W. H. Freeman