USA Today reported that about 47% of the general consumer population in the United States is loyal to the automobile manufacturer of their choice. Suppose Chevrolet did a study of a random sample of 981 Chevrolet owners and found that 492 said they would buy another Chevrolet. Does this indicate that the population proportion of consumers loyal to the car company is more than 47%? Use a = o.01. Solve the problem using both the traditional method and the P-value method. Since the sampling distribution of p is the normal distribution, you can use critical values from the standard normal distribution as shown in the table of critical values of the z distribution. (Round the test statistic and the critical value to two decimal places. Round the P-value to four decimal places.) test statistic = critical value = P-value = State your conclusion in context of the application. O There is sufficient evidence at the 0.01 level to conclude that the true proportion of consumers loyal to the car company is more than 47%. O There is insufficient evidence at the 0.01 level to conclude that the true proportion of consumers loyal to the car company is more than 47%. Compare your conclusion with the conclusion obtained by using the P-value method. Are they the same? O we reject the null hypothesis using the P-value method, but fail to reject using the traditional method. O The conclusions obtained by using both methods are the same. O We reject the null hypothesis using the traditional method, but fail to reject using the P-value method.
USA Today reported that about 47% of the general consumer population in the United States is loyal to the automobile manufacturer of their choice. Suppose Chevrolet did a study of a random sample of 981 Chevrolet owners and found that 492 said they would buy another Chevrolet. Does this indicate that the population proportion of consumers loyal to the car company is more than 47%? Use a = o.01. Solve the problem using both the traditional method and the P-value method. Since the sampling distribution of p is the normal distribution, you can use critical values from the standard normal distribution as shown in the table of critical values of the z distribution. (Round the test statistic and the critical value to two decimal places. Round the P-value to four decimal places.) test statistic = critical value = P-value = State your conclusion in context of the application. O There is sufficient evidence at the 0.01 level to conclude that the true proportion of consumers loyal to the car company is more than 47%. O There is insufficient evidence at the 0.01 level to conclude that the true proportion of consumers loyal to the car company is more than 47%. Compare your conclusion with the conclusion obtained by using the P-value method. Are they the same? O we reject the null hypothesis using the P-value method, but fail to reject using the traditional method. O The conclusions obtained by using both methods are the same. O We reject the null hypothesis using the traditional method, but fail to reject using the P-value method.

Holt Mcdougal Larson Pre-algebra: Student Edition 2012
1st Edition
ISBN:9780547587776
Author:HOLT MCDOUGAL
Publisher:HOLT MCDOUGAL
Chapter11: Data Analysis And Probability
Section: Chapter Questions
Problem 8CR

Related questions
Question
100%
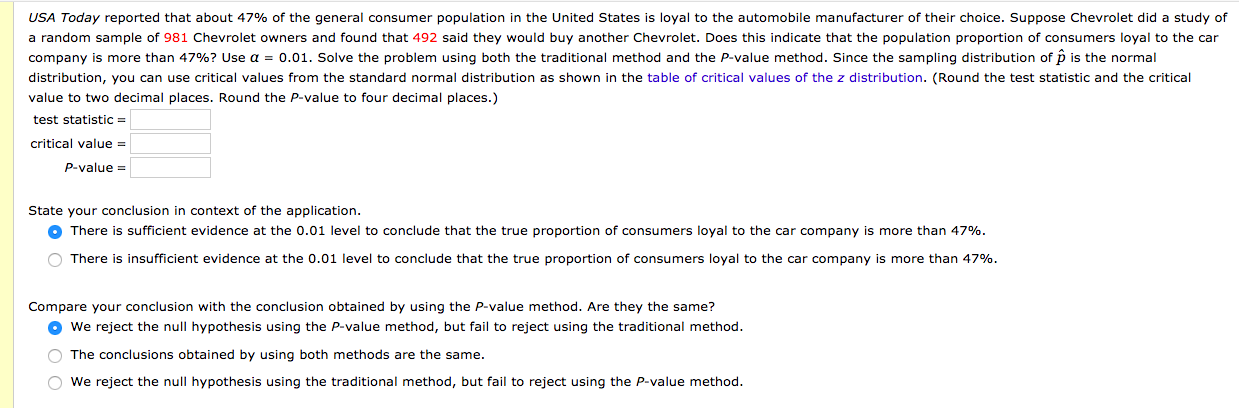
Transcribed Image Text:USA Today reported that about 47% of the general consumer population in the United States is loyal to the automobile manufacturer of their choice. Suppose Chevrolet did a study of
a random sample of 981 Chevrolet owners and found that 492 said they would buy another Chevrolet. Does this indicate that the population proportion of consumers loyal to the car
company is more than 47%? Use a = o.01. Solve the problem using both the traditional method and the P-value method. Since the sampling distribution of p is the normal
distribution, you can use critical values from the standard normal distribution as shown in the table of critical values of the z distribution. (Round the test statistic and the critical
value to two decimal places. Round the P-value to four decimal places.)
test statistic =
critical value =
P-value =
State your conclusion in context of the application.
O There is sufficient evidence at the 0.01 level to conclude that the true proportion of consumers loyal to the car company is more than 47%.
O There is insufficient evidence at the 0.01 level to conclude that the true proportion of consumers loyal to the car company is more than 47%.
Compare your conclusion with the conclusion obtained by using the P-value method. Are they the same?
O we reject the null hypothesis using the P-value method, but fail to reject using the traditional method.
O The conclusions obtained by using both methods are the same.
O We reject the null hypothesis using the traditional method, but fail to reject using the P-value method.
Expert Solution
This question has been solved!
Explore an expertly crafted, step-by-step solution for a thorough understanding of key concepts.

This is a popular solution!

Trending now
This is a popular solution!

Step by step
Solved in 4 steps with 2 images

Recommended textbooks for you
Holt Mcdougal Larson Pre-algebra: Student Edition…
Algebra
ISBN:
9780547587776
Author:
HOLT MCDOUGAL
Publisher:
HOLT MCDOUGAL
Holt Mcdougal Larson Pre-algebra: Student Edition…
Algebra
ISBN:
9780547587776
Author:
HOLT MCDOUGAL
Publisher:
HOLT MCDOUGAL