USA Today reported that about 47% of the general consumer population in the United States is loyal to the automobile manufacturer of their choice. Suppose Chevrolet did a study of a random sample of 1002 Chevrolet owners and found that 490 said they would buy another Chevrolet. Does this indicate that the population proportion of consumers loyal to Chevrolet is more than 47%? Use a = 0.01. (a) What is the level of significance? State the null and alternate hypotheses. O Ho: p > 0.47; H,: p = 0.47 Ho: p- 0.47; H,:p- 0.47 O Ho:p = 0.47; H,:p > 0.47 O Ho:p = 0.47; H,:p < 0.47 (b) What sampling distribution will you use? O The standard normal, since np > 5 and ng > 5. The standard normal, since np < 5 and ng < 5. The Student's t, since np < 5 and ng < 5. O The Student's t, since np > 5 and ng > 5. What is the value of the sample test statistic? (Round your answer to two decimal places.) (c) Find the P-value of the test statistic. (Round your answer to four decimal places.) Sketch the sampling distribution and show the area corresponding to the P-value. -1 1 -2 -1 1 2 0 1 -2 -1 0 -2 -1 2 3 (d) Based on your answers in parts (a) to (c), will you reject or fail to reject the null hypothesis? Are the data statistically significant at level a? O At the a = 0.01 level, we reject the null hypothesis and conclude the data are statistically significant. At the a = 0.01 level, we reject the null hypothesis and conclude the data are not statistically significant.
USA Today reported that about 47% of the general consumer population in the United States is loyal to the automobile manufacturer of their choice. Suppose Chevrolet did a study of a random sample of 1002 Chevrolet owners and found that 490 said they would buy another Chevrolet. Does this indicate that the population proportion of consumers loyal to Chevrolet is more than 47%? Use a = 0.01. (a) What is the level of significance? State the null and alternate hypotheses. O Ho: p > 0.47; H,: p = 0.47 Ho: p- 0.47; H,:p- 0.47 O Ho:p = 0.47; H,:p > 0.47 O Ho:p = 0.47; H,:p < 0.47 (b) What sampling distribution will you use? O The standard normal, since np > 5 and ng > 5. The standard normal, since np < 5 and ng < 5. The Student's t, since np < 5 and ng < 5. O The Student's t, since np > 5 and ng > 5. What is the value of the sample test statistic? (Round your answer to two decimal places.) (c) Find the P-value of the test statistic. (Round your answer to four decimal places.) Sketch the sampling distribution and show the area corresponding to the P-value. -1 1 -2 -1 1 2 0 1 -2 -1 0 -2 -1 2 3 (d) Based on your answers in parts (a) to (c), will you reject or fail to reject the null hypothesis? Are the data statistically significant at level a? O At the a = 0.01 level, we reject the null hypothesis and conclude the data are statistically significant. At the a = 0.01 level, we reject the null hypothesis and conclude the data are not statistically significant.

College Algebra (MindTap Course List)
12th Edition
ISBN:9781305652231
Author:R. David Gustafson, Jeff Hughes
Publisher:R. David Gustafson, Jeff Hughes
Chapter8: Sequences, Series, And Probability
Section8.7: Probability
Problem 58E: What is meant by the sample space of an experiment?

Related questions

Topic Video
Question
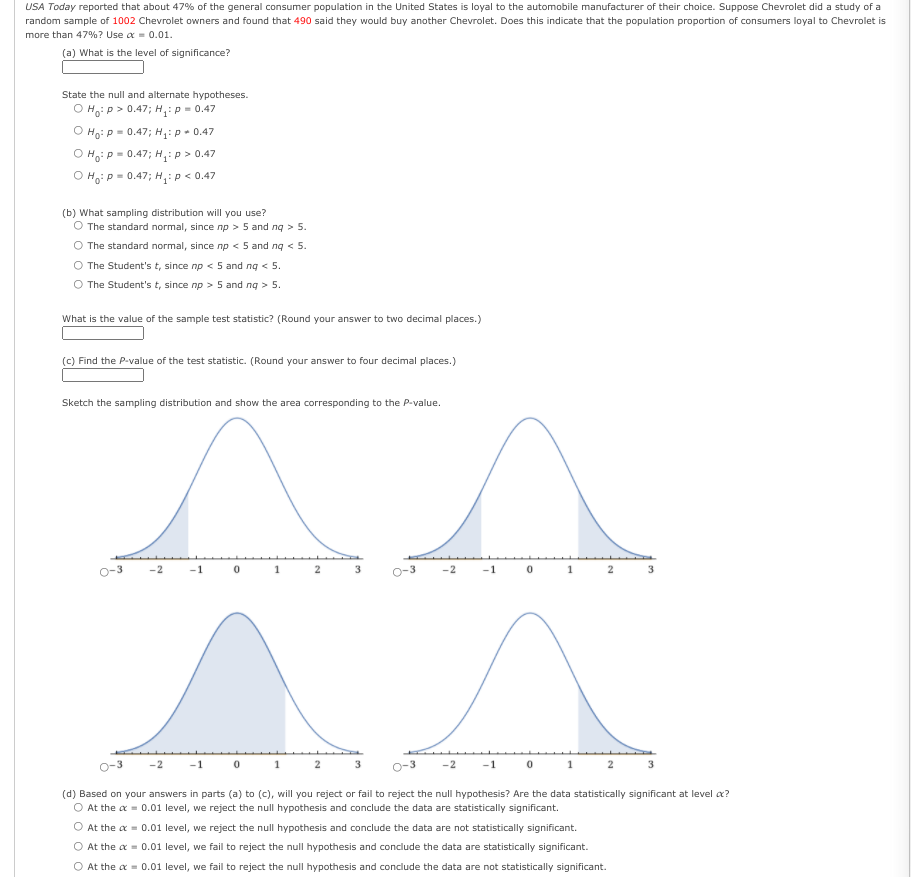
Transcribed Image Text:USA Today reported that about 47% of the general consumer population in the United States is loyal to the automobile manufacturer of their choice. Suppose Chevrolet did a study of a
random sample of 1002 Chevrolet owners and found that 490 said they would buy another Chevrolet. Does this indicate that the population proportion of consumers loyal to Chevrolet is
more than 47%? Use a = 0.01.
(a) What is the level of significance?
State the null and alternate hypotheses.
O Ho: p > 0.47; H,: p = 0.47
Ho: p- 0.47; H,:p- 0.47
O Ho:p = 0.47; H,:p > 0.47
O Ho:p = 0.47; H,:p < 0.47
(b) What sampling distribution will you use?
O The standard normal, since np > 5 and ng > 5.
The standard normal, since np < 5 and ng < 5.
The Student's t, since np < 5 and ng < 5.
O The Student's t, since np > 5 and ng > 5.
What is the value of the sample test statistic? (Round your answer to two decimal places.)
(c) Find the P-value of the test statistic. (Round your answer to four decimal places.)
Sketch the sampling distribution and show the area corresponding to the P-value.
-1
1
-2
-1
1
2
-1 0
0 1
-2
2
3
(d) Based on your answers in parts (a) to (c), will you reject or fail to reject the null hypothesis? Are the data statistically significant at level æ?
O At the a = 0.01 level, we reject the null hypothesis and conclude the data are statistically significant.
At the a = 0.01 level, we reject the null hypothesis and conclude the data are not statistically significant.
O At the a = 0.01 level, we fail to reject the null hypothesis and conclude the data are statistically significant.
O At the a = 0.01 level, we fail to reject the null hypothesis and conclude the data are not statistically significant.
Expert Solution
This question has been solved!
Explore an expertly crafted, step-by-step solution for a thorough understanding of key concepts.

Step by step
Solved in 2 steps with 1 images

Knowledge Booster


Learn more about
Need a deep-dive on the concept behind this application? Look no further. Learn more about this topic, statistics and related others by exploring similar questions and additional content below.Recommended textbooks for you
College Algebra (MindTap Course List)
Algebra
ISBN:
9781305652231
Author:
R. David Gustafson, Jeff Hughes
Publisher:
Cengage Learning

College Algebra (MindTap Course List)
Algebra
ISBN:
9781305652231
Author:
R. David Gustafson, Jeff Hughes
Publisher:
Cengage Learning