Use a = 0.05 to test whether the mean percentage of 17- to 24-year-olds who are attending college is the same for the four geographic regions. State the null and alternative hypotheses. O Hoi HN = HM = Hs = Hw H: HN * HM # Hs # HW O Ho: Not all the population means are equal. Myt = Sri = Wi = Nd :°H Myy = Si = Wri = Ni :®H O Hoi MN = MM = Hs = Hw H: Not all the population means are equal. O Ho: At least two of the population means are equal. H: At least two of the population means are different. Find the value of the test statistic. (Round your answer to two decimal places.) Find the p-value. (Round your answer to three decimal places.) p-value = State your conclusion. O Do not reject H. There is sufficient evidence to conclude that the percentage of 17- to 24-year-olds who are attending college is not the same for the four geographic regions. O Do not reject Ho. There is not sufficient evidence to conclude that the percentage of 17- to 24-year-olds who are attending college is not the same for the four geographic regions O Reject Ho. There is sufficient evidence to conclude that the percentage of 17- to 24-year-olds who are attending college is not the same for the four geographic regions. O Reject H. There is not sufficient evidence to conclude that the percentage of 17- to 24-year-olds who are attending college is not the same for the four geographic regions.
Use a = 0.05 to test whether the mean percentage of 17- to 24-year-olds who are attending college is the same for the four geographic regions. State the null and alternative hypotheses. O Hoi HN = HM = Hs = Hw H: HN * HM # Hs # HW O Ho: Not all the population means are equal. Myt = Sri = Wi = Nd :°H Myy = Si = Wri = Ni :®H O Hoi MN = MM = Hs = Hw H: Not all the population means are equal. O Ho: At least two of the population means are equal. H: At least two of the population means are different. Find the value of the test statistic. (Round your answer to two decimal places.) Find the p-value. (Round your answer to three decimal places.) p-value = State your conclusion. O Do not reject H. There is sufficient evidence to conclude that the percentage of 17- to 24-year-olds who are attending college is not the same for the four geographic regions. O Do not reject Ho. There is not sufficient evidence to conclude that the percentage of 17- to 24-year-olds who are attending college is not the same for the four geographic regions O Reject Ho. There is sufficient evidence to conclude that the percentage of 17- to 24-year-olds who are attending college is not the same for the four geographic regions. O Reject H. There is not sufficient evidence to conclude that the percentage of 17- to 24-year-olds who are attending college is not the same for the four geographic regions.

Glencoe Algebra 1, Student Edition, 9780079039897, 0079039898, 2018
18th Edition
ISBN:9780079039897
Author:Carter
Publisher:Carter
Chapter10: Statistics
Section10.6: Summarizing Categorical Data
Problem 4AGP

Related questions
Question
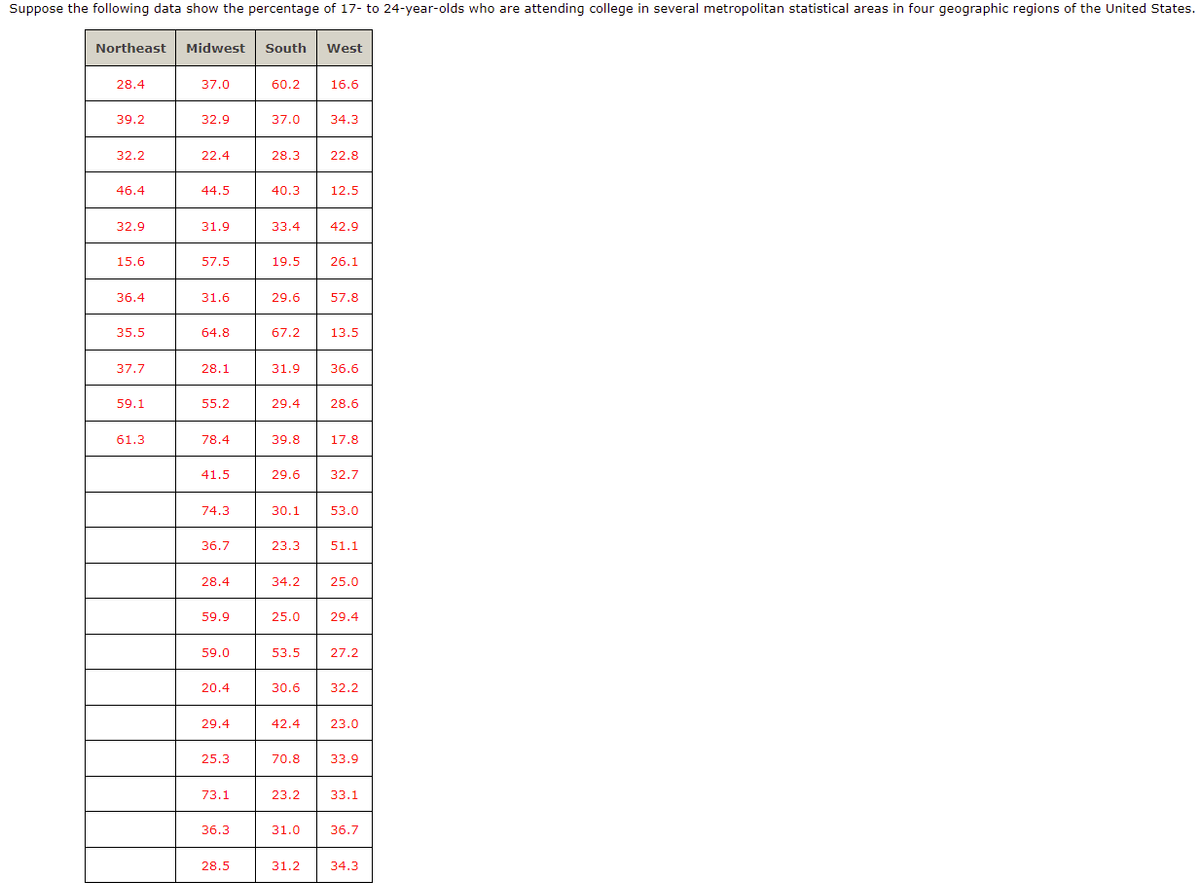
Transcribed Image Text:Suppose the following data show the percentage of 17- to 24-year-olds who are attending college in several metropolitan statistical areas in four geographic regions of the United States.
Northeast
Midwest
South
West
28.4
37.0
60.2
16.6
39.2
32.9
37.0
34.3
32.2
22.4
28.3
22.8
46.4
44.5
40.3
12.5
32.9
31.9
33.4
42.9
15.6
57.5
19.5
26.1
36.4
31.6
29.6
57.8
35.5
64.8
67.2
13.5
37.7
28.1
31.9
36.6
59.1
55.2
29.4
28.6
61.3
78.4
39.8
17.8
41.5
29.6
32.7
74.3
30.1
53.0
36.7
23.3
51.1
28.4
34.2
25.0
59.9
25.0
29.4
59.0
53.5
27.2
20.4
30.6
32.2
29.4
42.4
23.0
25.3
70.8
33.9
73.1
23.2
33.1
36.3
31.0
36.7
28.5
31.2
34.3
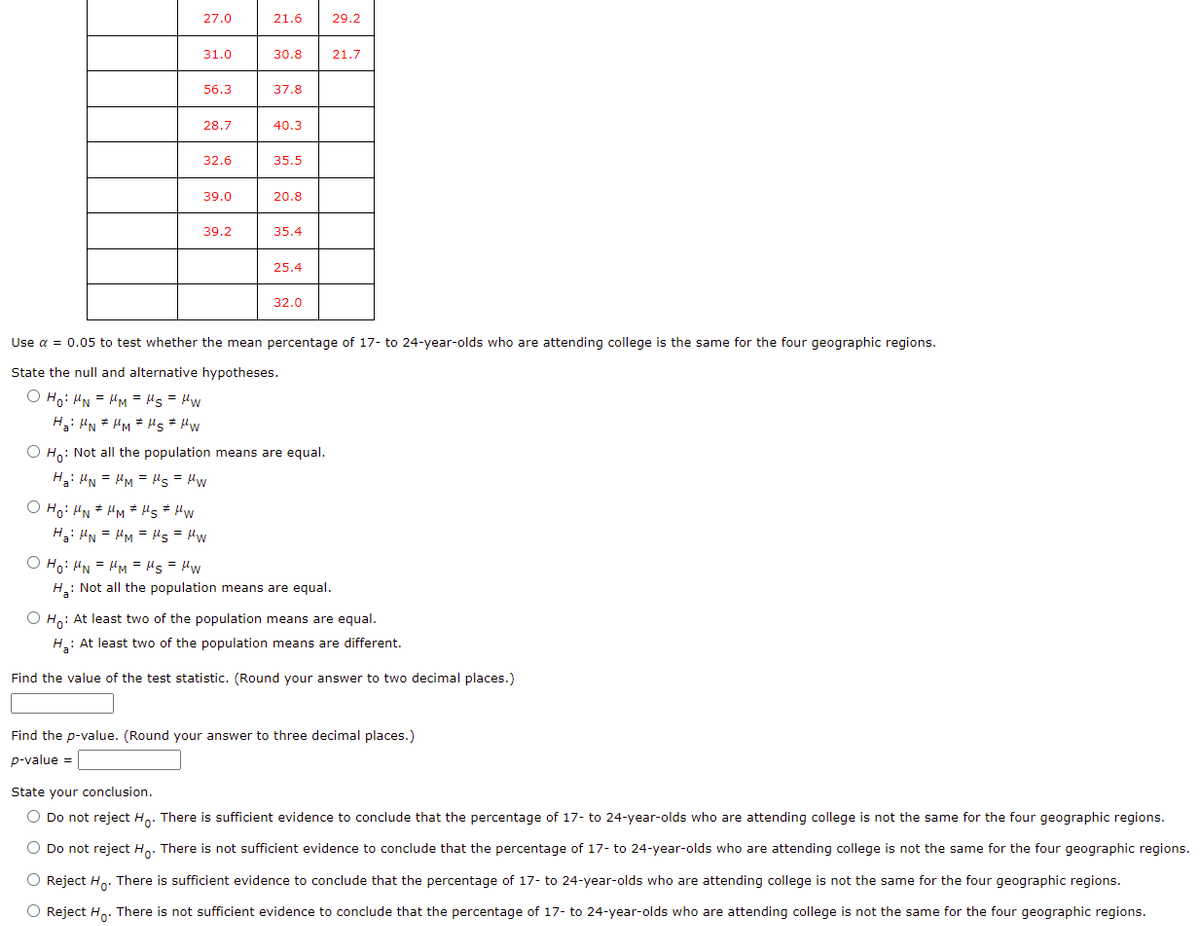
Transcribed Image Text:27.0
21.6
29.2
31.0
30.8
21.7
56.3
37.8
28.7
40.3
32.6
35.5
39.0
20.8
39.2
35.4
25.4
32.0
Use a = 0.05 to test whether the mean percentage of 17- to 24-year-olds who are attending college is the same for the four geographic regions.
State the null and alternative hypotheses.
Myt = Sl = WH = N :°H O
Ha: HN * HM * Hs# Hw
O Ho: Not all the population means are equal.
Ha: "N = HM = Hs = Hw
O Ho: HN * HM * Hs# Hw
Myi = Sri = Wi = Ni :°H
O Ho: HN = HM = "s = Hw
H.: Not all the population means are equal.
O Ho: At least two of the population means are equal.
H.: At least two of the population means are different.
Find the value of the test statistic. (Round your answer to two decimal places.)
Find the p-value. (Round your answer to three decimal places.)
p-value =
State your conclusion.
O Do not reject Ho: There is sufficient evidence to conclude that the percentage of 17- to 24-year-olds who are attending college is not the same for the four geographic regions.
O Do not reject Ho: There is not sufficient evidence to conclude that the percentage of 17- to 24-year-olds who are attending college is not the same for the four geographic regions.
O Reject H,. There is sufficient evidence to conclude that the percentage of 17- to 24-year-olds who are attending college is not the same for the four geographic regions.
O Reject Ho. There is not sufficient evidence to conclude that the percentage of 17- to 24-year-olds who are attending college is not the same for the four geographic regions.
Expert Solution
This question has been solved!
Explore an expertly crafted, step-by-step solution for a thorough understanding of key concepts.

This is a popular solution!

Trending now
This is a popular solution!

Step by step
Solved in 2 steps with 1 images

Recommended textbooks for you
Glencoe Algebra 1, Student Edition, 9780079039897…
Algebra
ISBN:
9780079039897
Author:
Carter
Publisher:
McGraw Hill
Glencoe Algebra 1, Student Edition, 9780079039897…
Algebra
ISBN:
9780079039897
Author:
Carter
Publisher:
McGraw Hill