12. An engineer wants to compare the tensile strengths of steel bars that are produced using a conventional method and an experimental method. (The tensile strength of a metal is a measure of its ability to resist tearing when pulled lengthwise.) To do so, the engineer randomly selects steel bars that are manufactured using each method and records the following tensile strengths (in Newtons per square millimeter). At a =.10, can the engineer claim that the experimental method produces steel with greater mean tensile strength? Should the engineer recommend using the experimental method? First use the F test to determine whether or not to use equal variances in choosing the model.(Use Excel to find x and sfor each method) Experimental 395 Conventional 362 389 421 394 407 411 389 402 422 416 402 408 400 386 411 405 389 352 380 382 413 384 400 378 419 379 384 388 372 383
12. An engineer wants to compare the tensile strengths of steel bars that are produced using a conventional method and an experimental method. (The tensile strength of a metal is a measure of its ability to resist tearing when pulled lengthwise.) To do so, the engineer randomly selects steel bars that are manufactured using each method and records the following tensile strengths (in Newtons per square millimeter). At a =.10, can the engineer claim that the experimental method produces steel with greater mean tensile strength? Should the engineer recommend using the experimental method? First use the F test to determine whether or not to use equal variances in choosing the model.(Use Excel to find x and sfor each method) Experimental 395 Conventional 362 389 421 394 407 411 389 402 422 416 402 408 400 386 411 405 389 352 380 382 413 384 400 378 419 379 384 388 372 383

Glencoe Algebra 1, Student Edition, 9780079039897, 0079039898, 2018
18th Edition
ISBN:9780079039897
Author:Carter
Publisher:Carter
Chapter10: Statistics
Section10.3: Measures Of Spread
Problem 1GP

Related questions
Topic Video
Question
- An engineer wants to compare the tensile strengths of steel bars that are produced using a conventional method and an experimental method. (The tensile strength of a metal is a measure of its ability to resist tearing when pulled lengthwise.) To do so, the engineer randomly selects steel bars that are manufactured using each method and records the following tensile strengths (in Newtons per square millimeter). At α=.10, can the engineer claim that the experimental method produces steel with greater mean tensile strength? Should the
engineer recommend using the experimental method? First use the F test to determine whether or not to use
equal variances in choosing the model.(??? ????? ?? ???? ?̅ ??? ? ??? ???ℎ ???ℎ??)
Experimental 395 389 421 394 407 411 389 402 422 416 402 408 400 386 411 405 389
Conventional 362 352 380 382 413 384 400 378 419 379 384 388 372 383
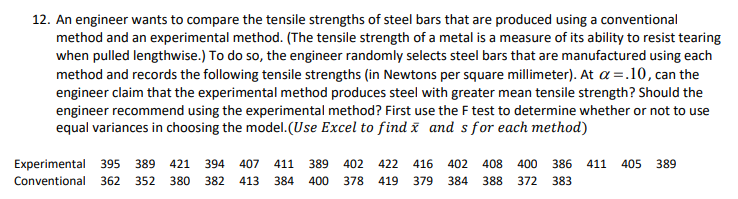
Transcribed Image Text:12. An engineer wants to compare the tensile strengths of steel bars that are produced using a conventional
method and an experimental method. (The tensile strength of a metal is a measure of its ability to resist tearing
when pulled lengthwise.) To do so, the engineer randomly selects steel bars that are manufactured using each
method and records the following tensile strengths (in Newtons per square millimeter). At a =.10, can the
engineer claim that the experimental method produces steel with greater mean tensile strength? Should the
engineer recommend using the experimental method? First use the F test to determine whether or not to use
equal variances in choosing the model.(Use Excel to find x and sfor each method)
Experimental 395
Conventional 362
389
421
394
407
411
389
402 422 416
402
408
400 386
411
405 389
352
380
382
413
384
400
378
419
379
384
388
372
383
Expert Solution
Step 1
| Experimental | Conventional |
| 395 | 362 |
| 389 | 352 |
| 421 | 380 |
| 394 | 382 |
| 407 | 413 |
| 411 | 384 |
| 389 | 400 |
| 402 | 378 |
| 422 | 419 |
| 416 | 379 |
| 402 | 384 |
| 408 | 388 |
| 400 | 372 |
| 386 | 383 |
| 411 | |
| 405 | |
| 389 |

Trending now
This is a popular solution!

Step by step
Solved in 3 steps with 2 images

Knowledge Booster


Learn more about
Need a deep-dive on the concept behind this application? Look no further. Learn more about this topic, statistics and related others by exploring similar questions and additional content below.Recommended textbooks for you
Glencoe Algebra 1, Student Edition, 9780079039897…
Algebra
ISBN:
9780079039897
Author:
Carter
Publisher:
McGraw Hill
Glencoe Algebra 1, Student Edition, 9780079039897…
Algebra
ISBN:
9780079039897
Author:
Carter
Publisher:
McGraw Hill