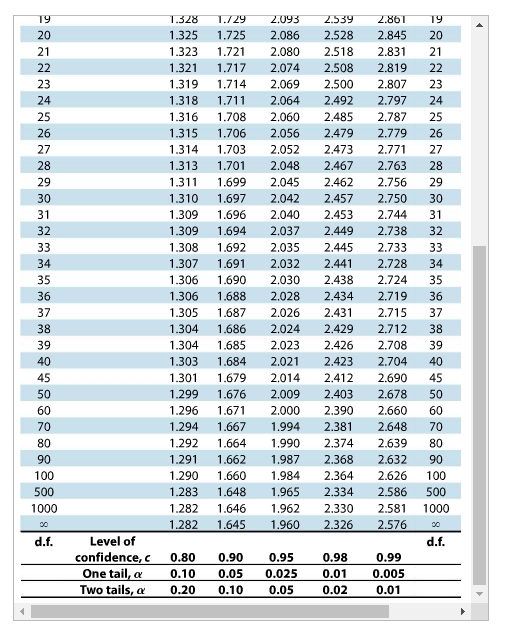
Use a t-test to test the claim about the population mean p at the given level of significance a using the given sample statistics. Assume the population is normally distributed. Claim: u= 52,500; a= 0.10 Sample statistics: x 51,794, s= 3000, n = 17 T-distribution table E Click the icon to view the t-distribution table. ... What are the null and alternative hypotheses? Choose the correct answer below. Level of confidence, C 0.80 0.90 0.95 0.98 0.99 O A. H: u2 52,500 H, p< 52,500 ОВ. На и#52,500 H, p= 52,500 One tail, a 0.05 0.10 0.10 0.025 0.01 0.005 d.f. Two tails, a 0.20 0.05 12.706 0.02 0.01 d.f. 3.078 6.314 31.821 31.821 63.657 1 Ос. Н. и52,500 H, p 52,500 OD. H us52,500 H, u> 52,500 1.886 2.920 4.303 6.965 9.925 2 3. 1.638 2.353 3.182 4.541 5.841 3 4 1.533 2.132 2.776 3.747 4.604 4 1.476 2.015 2.571 3.365 4.032 What is the value of the standardized test statistic? 5 6 6. 1,440 1.943 1.895 2.447 3.143 3.707 1,415 2.365 2.998 3.499 The standardized test statistic is. (Round to two decimal places as needed.) 8 1.397 1.860 1.833 3.355 8 3.250 9 2.306 2.896 9 1.383 2.262 2.821 What is(are) the critical value(s)? 10 1372 1.812 2.228 2.764 3.169 10 11 1.363 1.796 2.201 2.718 3.106 11 The critical value(s) is(are)O. 12 1.356 1.782 2.179 2.681 3.055 12 (Round to three decimal places as needed. Use a comma to separate answers as needed.) 13 1.350 1,771 2,160 2.650 3.012 13 14 1.345 1,761 2.145 2.624 2.977 14 Decide whether to reject or fail to reject the null hypothesis. 2.602 2583 2.567 15 1.341 1.753 2.131 2.947 15 1.337 1.746 2.120 2.110 16 2.921 16 O A. Fail to reject Ho. There is not enough evidence to reject the claim. 1.333 1.740 1.330 1.734 1.328 17 2.898 17 18 2.101 2.552 2.878 18 O B. Reject Ho. There is enough evidence to reject the claim. 19 1,729 1.325 1.725 2.093 2.539 2.861 19 20 2.086 2528 2.845 20 OC. Reject Ho. There is not enough evidence to reject the claim. 21 1.323 1.721 2.080 2518 2.831 21 22 1.321 1.717 2.074 2508 2.819 22 OD. Fail to reject Hg. There is enough evidence to reject the claim. 23 1.319 2.069 1.318 1.711 2.064 1.714 2.500 2.807 23 24 2.492 2.797 24 25 1.316 1,708 2.060 2.485 2,787 25 1.315 1.706 2.056 2479 2.779 26 27 1.314 1.703 2.052 2473 2.771 27 28 1.313 1.701 2.048 2.467 2.763 28 29 1.311 1.699 2.045 2.462 2.756 29 30 1.310 1.697 2.042 2.457 2.750 2.040 30 31 1.309 1.696 2.453 2.744 31 1900 1604 F*********:
Use a t-test to test the claim about the population mean p at the given level of significance a using the given sample statistics. Assume the population is normally distributed. Claim: u= 52,500; a= 0.10 Sample statistics: x 51,794, s= 3000, n = 17 T-distribution table E Click the icon to view the t-distribution table. ... What are the null and alternative hypotheses? Choose the correct answer below. Level of confidence, C 0.80 0.90 0.95 0.98 0.99 O A. H: u2 52,500 H, p< 52,500 ОВ. На и#52,500 H, p= 52,500 One tail, a 0.05 0.10 0.10 0.025 0.01 0.005 d.f. Two tails, a 0.20 0.05 12.706 0.02 0.01 d.f. 3.078 6.314 31.821 31.821 63.657 1 Ос. Н. и52,500 H, p 52,500 OD. H us52,500 H, u> 52,500 1.886 2.920 4.303 6.965 9.925 2 3. 1.638 2.353 3.182 4.541 5.841 3 4 1.533 2.132 2.776 3.747 4.604 4 1.476 2.015 2.571 3.365 4.032 What is the value of the standardized test statistic? 5 6 6. 1,440 1.943 1.895 2.447 3.143 3.707 1,415 2.365 2.998 3.499 The standardized test statistic is. (Round to two decimal places as needed.) 8 1.397 1.860 1.833 3.355 8 3.250 9 2.306 2.896 9 1.383 2.262 2.821 What is(are) the critical value(s)? 10 1372 1.812 2.228 2.764 3.169 10 11 1.363 1.796 2.201 2.718 3.106 11 The critical value(s) is(are)O. 12 1.356 1.782 2.179 2.681 3.055 12 (Round to three decimal places as needed. Use a comma to separate answers as needed.) 13 1.350 1,771 2,160 2.650 3.012 13 14 1.345 1,761 2.145 2.624 2.977 14 Decide whether to reject or fail to reject the null hypothesis. 2.602 2583 2.567 15 1.341 1.753 2.131 2.947 15 1.337 1.746 2.120 2.110 16 2.921 16 O A. Fail to reject Ho. There is not enough evidence to reject the claim. 1.333 1.740 1.330 1.734 1.328 17 2.898 17 18 2.101 2.552 2.878 18 O B. Reject Ho. There is enough evidence to reject the claim. 19 1,729 1.325 1.725 2.093 2.539 2.861 19 20 2.086 2528 2.845 20 OC. Reject Ho. There is not enough evidence to reject the claim. 21 1.323 1.721 2.080 2518 2.831 21 22 1.321 1.717 2.074 2508 2.819 22 OD. Fail to reject Hg. There is enough evidence to reject the claim. 23 1.319 2.069 1.318 1.711 2.064 1.714 2.500 2.807 23 24 2.492 2.797 24 25 1.316 1,708 2.060 2.485 2,787 25 1.315 1.706 2.056 2479 2.779 26 27 1.314 1.703 2.052 2473 2.771 27 28 1.313 1.701 2.048 2.467 2.763 28 29 1.311 1.699 2.045 2.462 2.756 29 30 1.310 1.697 2.042 2.457 2.750 2.040 30 31 1.309 1.696 2.453 2.744 31 1900 1604 F*********:

MATLAB: An Introduction with Applications
6th Edition
ISBN:9781119256830
Author:Amos Gilat
Publisher:Amos Gilat
Chapter1: Starting With Matlab
Section: Chapter Questions
Problem 1P

Related questions
Question
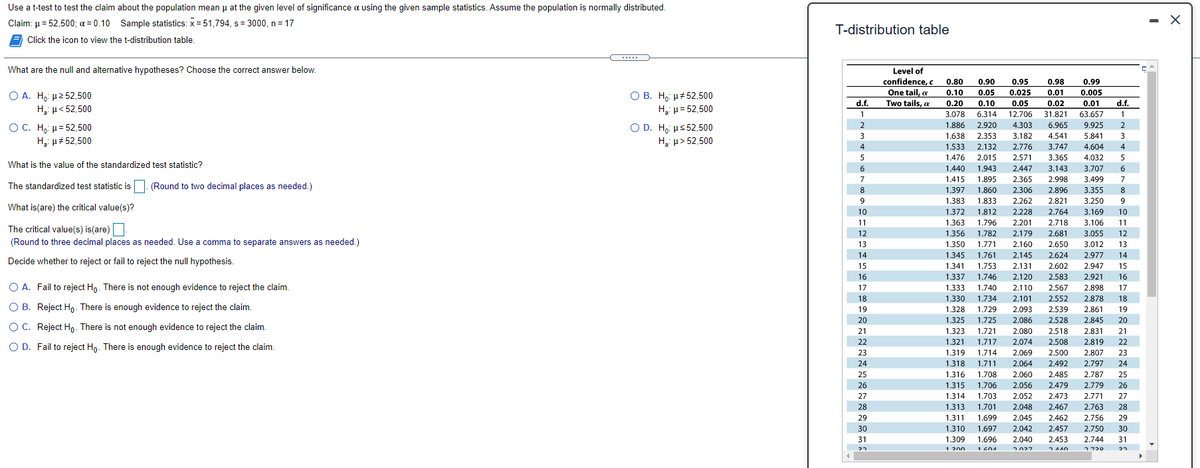
Transcribed Image Text:Use a t-test to test the claim about the population mean u at the given level of significance a using the given sample statistics. Assume the population is normally distributed.
2.160
Claim: µ = 52,500; a = 0.10 Sample statistics: x =51,794, s= 3000, n = 17
- X
T-distribution table
Click the icon to view the t-distribution table.
.....
What are the null and alternative hypotheses? Choose the correct answer below.
Level of
confidence, c
0.80
0.90
0.95
0.98
0.99
One tail, a
Two tails, a
0.01
O A. Ho: µ2 52,500
H,: µ< 52,500
О В. Н. и#52,500
H u= 52,500
0.10
0.05
0.025
0.005
d.f.
0.20
0.10
0.05
0.02
0.01
d.f.
12.706
4.303
1
3.078
6.314
31.821
63.657
1
OC. H,: µ= 52,500
O D. H, us 52,500
H: p> 52,500
2
1.886
2.920
6.965
9.925
1.638
2.353
3.182
4.541
5.841
H: µ# 52,500
4
1,533
2.132
2.776
3.747
4.604
4
1.476
2.015
2.571
3.365
4.032
What is the value of the standardized test statistic?
1.440
1.943
2.447
3.143
3.707
1.895
1.860
1.833
1.812
2.365
2.306
2.262
1.415
1.397
1.383
2.998
2.896
7
3.499
The standardized test statistic is. (Round to two decimal places as needed.)
3.355
9
2.821
3.250
9
What is(are) the critical value(s)?
10
1.372
2.228
2.764
3.169
10
11
1.363
1.796
2.201
2.718
3.106
11
The critical value(s) is(are)
(Round to three decimal places as needed. Use a comma to separate answers as needed.)
12
1.356
1.782
2.179
2.681
3.055
12
13
1.350
1.771
2.160
2.650
3.012
13
14
1.345
1,761
2.145
2.624
2.977
14
Decide whether to reject or fail to reject the null hypothesis.
15
1.341
1.753
2.131
2.602
2.947
15
16
1.337
1.746
2,120
2.583
2.921
16
O A. Fail to reject Ho. There is not enough evidence to reject the claim.
17
2 567
2 898
1333
1.740
2.110
2.567
2.898
17
18
1.330
1.734
2.101
2.552
2.878
18
O B. Reject Ho. There is enough evidence to reject the claim.
2.093
2.539
19
1.328
1.729
2.861
19
2,086
2.080
20
1.325
1.725
2.528
2.845
20
OC. Reject H,. There is not enough evidence to reject the claim.
21
1.323
1.721
2.518
2.831
21
22
1.321
1,717
2.074
2.508
2.819
22
O D. Fail to reject Ho. There is enough evidence to reject the claim.
23
1.319
1.714
2.069
2.500
2.807
23
24
1.318 1.711
2.064
2,492
2.797
24
25
1.316 1.708
2.060
2.485
2.787
25
26
1.315 1.706
2.056
2.479
2,779
26
27
1.314
1.703
2.052
2.473
2.771
27
28
1.313
1.701
2.048
2.467
2.763
28
29
1,311
1.699
2.045
2,462
2.756
29
30
1.310
1.697
2.042
2.457
2.750
30
31
1.309
1.696
2.040
2.453
2.744
31
1 200
1 404
2027
5790
Transcribed Image Text:19
1.328
1,/29
2.093
2.539
2.86T
19
20
1.325
1.725
2,086
2.528
2.845
20
21
1.323
1.721
2.080
2.518
2.831
21
22
1.321
1.717
2.074
2.508
2.819
22
23
1.319
1.714
2,069
2.500
2.807
23
24
1.318
1.711
2.064
2.492
2.797
24
25
1.316
1.708
2.060
2.485
2.787
25
26
1.315
1.706
2.056
2.479
2,779
26
27
1.314
1.703
2.052
2.473
2.771
27
28
1.313
1.701
2.048
2.467
2.763
28
29
1.311
1.699
2.045
2.462
2.756
29
30
1.310
1.697
2.042
2.457
2.750
30
31
1.309
1.696
2.040
2.453
2.744
31
32
1.309
1.694
2.037
2.449
2.738
32
33
1.308
1.692
2.035
2.445
2.733
33
34
1.307
1.691
2.032
2.441
2.728
34
35
1.306
1.690
2.030
2.438
2.724
35
36
1.306
1.688
2.028
2.434
2.719
36
37
1.305
1.687
2.026
2.431
2.715
37
38
1.304
1.686
2.024
2.429
2.712
38
39
1.304
1.685
2.023
2.426
2.708
39
40
1.303
1.684
2.021
2.423
2.704
40
45
1.301
1.679
2.014
2.412
2.690
45
50
1.299
1.676
2.009
2.403
2.678
50
60
1.296
1.671
2.000
2,390
2.660
60
70
1.294
1.667
1.994
2.381
2.648
70
80
1.292
1.664
1.990
2.374
2.639
80
90
1.291
1.662
1,987
2.368
2.632
90
100
1.290
1.660
1.984
2.364
2.626
100
500
1.283
1.648
1.965
2.334
2.586
500
1000
1.282
1.646
1.962
2.330
2.581
1000
1.282
1.645
1.960
2.326
2.576
d.f.
Level of
d.f.
confidence, c
One tail, a
Two tails, a
0.80
0.90
0.95
0.98
0.99
0.10
0.05
0.025
0.01
0.005
0.20
0.10
0.05
0.02
0.01
Expert Solution
This question has been solved!
Explore an expertly crafted, step-by-step solution for a thorough understanding of key concepts.

This is a popular solution!

Trending now
This is a popular solution!

Step by step
Solved in 2 steps with 2 images

Recommended textbooks for you
MATLAB: An Introduction with Applications
Statistics
ISBN:
9781119256830
Author:
Amos Gilat
Publisher:
John Wiley & Sons Inc

Probability and Statistics for Engineering and th…
Statistics
ISBN:
9781305251809
Author:
Jay L. Devore
Publisher:
Cengage Learning

Statistics for The Behavioral Sciences (MindTap C…
Statistics
ISBN:
9781305504912
Author:
Frederick J Gravetter, Larry B. Wallnau
Publisher:
Cengage Learning
MATLAB: An Introduction with Applications
Statistics
ISBN:
9781119256830
Author:
Amos Gilat
Publisher:
John Wiley & Sons Inc
Probability and Statistics for Engineering and th…
Statistics
ISBN:
9781305251809
Author:
Jay L. Devore
Publisher:
Cengage Learning
Statistics for The Behavioral Sciences (MindTap C…
Statistics
ISBN:
9781305504912
Author:
Frederick J Gravetter, Larry B. Wallnau
Publisher:
Cengage Learning

Elementary Statistics: Picturing the World (7th E…
Statistics
ISBN:
9780134683416
Author:
Ron Larson, Betsy Farber
Publisher:
PEARSON

The Basic Practice of Statistics
Statistics
ISBN:
9781319042578
Author:
David S. Moore, William I. Notz, Michael A. Fligner
Publisher:
W. H. Freeman

Introduction to the Practice of Statistics
Statistics
ISBN:
9781319013387
Author:
David S. Moore, George P. McCabe, Bruce A. Craig
Publisher:
W. H. Freeman