Use following data to plot a graph of distance versus time. Determine the slope at t=2 and t=4 sec. 2. Time- Sec Distance-m 1 1 2 4 3 4 16 25 6. 36 7 49 8. 64
Use following data to plot a graph of distance versus time. Determine the slope at t=2 and t=4 sec. 2. Time- Sec Distance-m 1 1 2 4 3 4 16 25 6. 36 7 49 8. 64

University Physics Volume 1
18th Edition
ISBN:9781938168277
Author:William Moebs, Samuel J. Ling, Jeff Sanny
Publisher:William Moebs, Samuel J. Ling, Jeff Sanny
Chapter3: Motion Along A Straight Line
Section: Chapter Questions
Problem 4CQ: Give an example of a device used to measure time and identify what change in that device indicates a...

Related questions

Question
I need help on this question
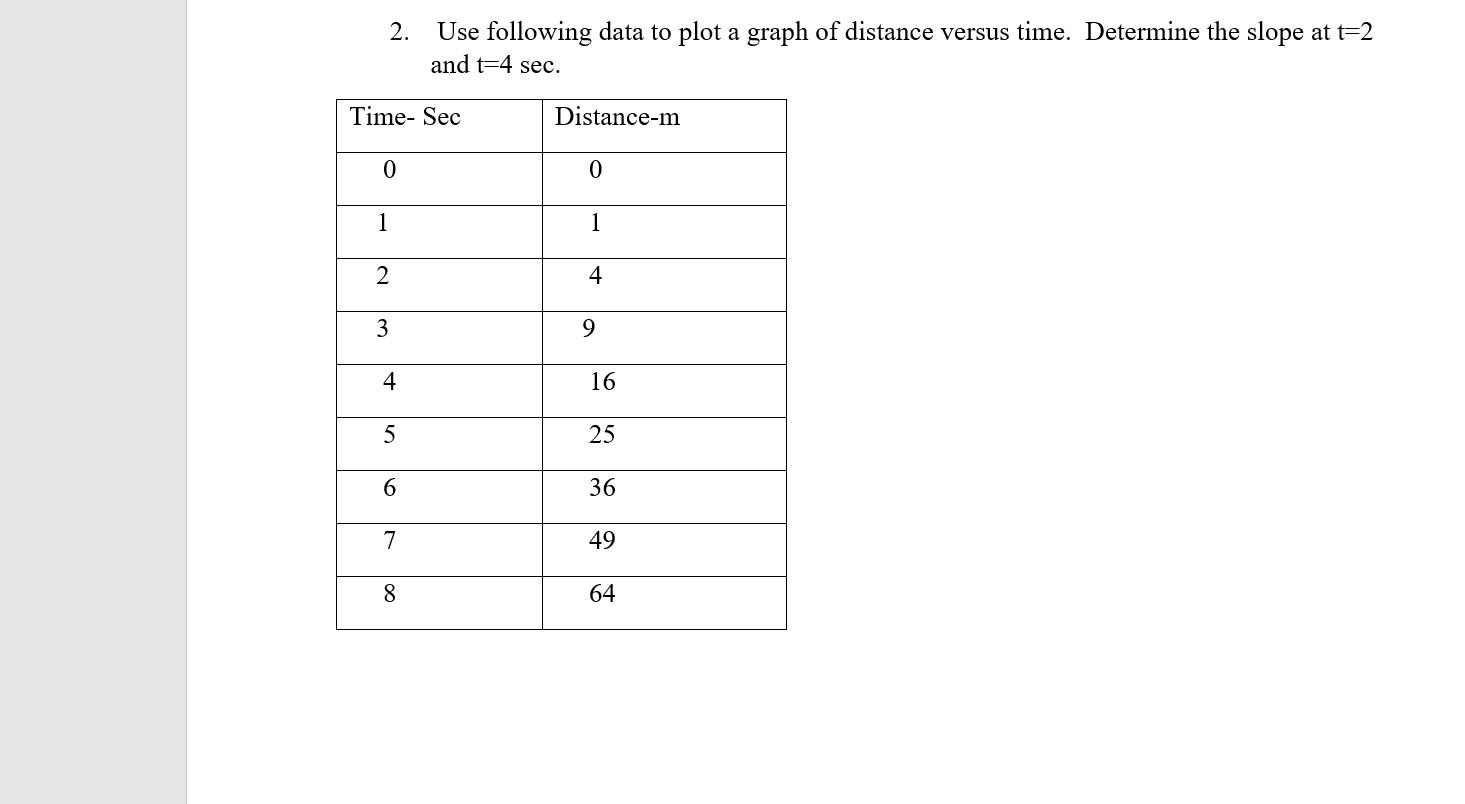
Transcribed Image Text:Use following data to plot a graph of distance versus time. Determine the slope at t=2
and t=4 sec.
2.
Time- Sec
Distance-m
1
1
2
4
3
4
16
25
6.
36
7
49
8.
64
Expert Solution
This question has been solved!
Explore an expertly crafted, step-by-step solution for a thorough understanding of key concepts.

This is a popular solution!

Trending now
This is a popular solution!

Step by step
Solved in 5 steps with 3 images

Knowledge Booster


Learn more about
Need a deep-dive on the concept behind this application? Look no further. Learn more about this topic, physics and related others by exploring similar questions and additional content below.Recommended textbooks for you
University Physics Volume 1
Physics
ISBN:
9781938168277
Author:
William Moebs, Samuel J. Ling, Jeff Sanny
Publisher:
OpenStax - Rice University

College Physics
Physics
ISBN:
9781938168000
Author:
Paul Peter Urone, Roger Hinrichs
Publisher:
OpenStax College
University Physics Volume 1
Physics
ISBN:
9781938168277
Author:
William Moebs, Samuel J. Ling, Jeff Sanny
Publisher:
OpenStax - Rice University
College Physics
Physics
ISBN:
9781938168000
Author:
Paul Peter Urone, Roger Hinrichs
Publisher:
OpenStax College