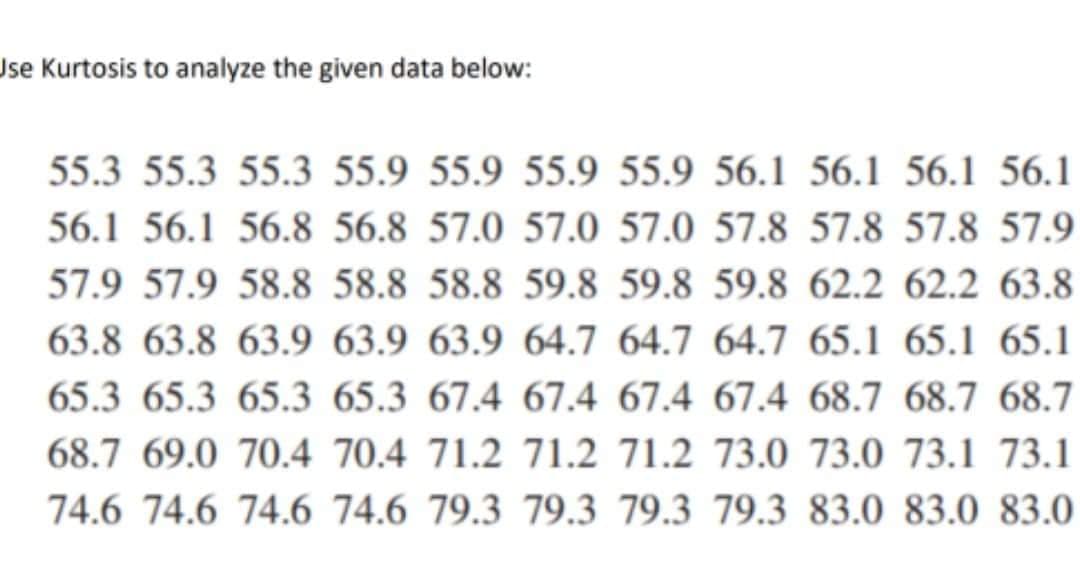
Use Kurtosis to analyze the given data below:


Q: Select the term that best fits the definition: 1. This term equals this: (σ)/(sqrt(n)) 2. phat*n…
A:
Q: or plans to sell
A: Par Value of Bond is $1000 Coupon rate is 7.5% Yield is 5% Time to maturity is 5 years Bond is sold…
Q: A marriage counselor has traditionally seen that the proportion p of all married couples for whom…
A: As Prof. N. G. Das said "A hypothesis which is tested for plausible rejection is called the Null…
Q: Using the TI-84 Plus calculator, find the area under the standard normal curve that lies between the…
A: Are under normal curve has calculated using TI-84 Plus calculator.
Q: z is a standard normal random variable. The P (-1.20 z 1.50) equals a. 0.8181 b. 0.4332…
A: Given A multiple choice question based a random variable.
Q: What is the Sample Skewness for the following numbers: mean of 100.89 , median of 95, and standard…
A: Given mean of 100.89 medianof 95 standard deviation of 52.38
Q: Consider the following hypothesis test Ho: μ1=μ2 Ha: μ1#μ2 The following results are for two…
A: As per our guidelines we can solve first three sub part of question and rest can be reposted.…
Q: To determine the relationship between years of education and salary potential, 10 persons who have…
A: "Since you have posted a question with multiple subparts, we will solve first 3 sub-parts for you.…
Q: A factory produces a total of 300 computer: per day which are on the average computers are…
A: Solution: Let X be the number of computers are defective. The probability of defective computer is…
Q: A psychologist obtains a random sample of 20 mothers in the first trimester of their pregnancy. The…
A: Given that Sample size n =20 Sample mean =104.3 Sample standard deviation =14
Q: A PC board contains 205 components. Each component has the probability of not failing as 0.9996. All…
A:
Q: Use the formula Z = x = = 7 μ = 8 o=5 x-μ σ Round to 4 decimal places Z to find z when
A:
Q: Mr. B asserts that fewer than 5% of the battery that he sells are defectives. Suppose 200 battery…
A: Given data: p=0.05 n = 200 X = 8 Significance level = α=0.01
Q: The investor plans to second coupon payme
A: Par Value of Bond is $1000 Coupon rate is 7.5% Yield is 5% Time to maturity is 5 years Bond is sold…
Q: Select the term that best fits this definition: 1. This equals the expected value of a sample mean…
A: Given that 1. This equals the expected value of a sample mean for a sampling distribution 2. This…
Q: > A DJ is preparing a playlist of 20 songs. How many different ways can the DJ arrange the first…
A:
Q: Discuss the method of. Data collection in statistics
A: Solution Given Data collection in statistics
Q: Question 18 What is the p-value for a two-tailed test statistic Tstat 1.85 with 54 degrees of…
A:
Q: e independer t makes sense to do ares estimate for F
A: (a) The assumptions as, 1. The expected value of the mean of the error terms εi will be zero when…
Q: 4 students apply to a PhD program. The program accepts 70% of all applicants. Students are accepted…
A: Let there are n trials and each having two outcomes - Success and Failure. The trials are…
Q: Suppose that E and F are two events and that P(E and F)=0.1 and P(E)=0.5. What is P(F|E)?
A:
Q: The investor plans to sell the bo second coupon payment is recei
A: Given as, Par Value of Bond is $1000 Coupon rate is 7.5% Yield is 5% Time to maturity is 5 years…
Q: 2. The following data represent the Statistics grade and intelligence test administered by the…
A: For the given data we have to calculate correlation coefficient, regression equation, scatterplot…
Q: The number (in thousands) of new houses sold each month in a country over a four year period is…
A: The given data for new houses sold each month is as follows: Year 1 Year 2 Year 3 Year 4 Jan…
Q: Consider the following random sample of diameter measurements (in inches) of 17 Softballs. 4.79,…
A: Solution Given
Q: Calculate the reliability of the following system: 0.80 0.90 0.90 0.85 0.80 ID 0.60 0.72 0.80
A: Here we can see System is combination in parallel and than series, Formula for parallel Reliability…
Q: What percentage of the class consists of freshman, sophomores, and juniors? A) 14% B) 86% C) 54% D)…
A:
Q: What is the average of the following numbers 2, 5, 8,1?
A: Given data set is 2,5,8,1sample size(n)=4
Q: The values listed below are waiting times (in minutes) of customers at two different banks. At…
A:
Q: 1. A full house in poker is a hand where three cards share one rank and two cards share another…
A:
Q: An insurance company crashed four cars in succession at 5 miles per hour. The cost of repair for…
A: Given data is ,424 , 455, 406, 211
Q: Exit polls, or interviews with voters right after they cast their ballots, are conducted by a…
A: Given information: P(Final election winner) = 0.60
Q: In a positively skewed distribution: a. the median equals the mean. b. the mean can be…
A: When the tail of the distribution is elongated to the right side, the shape of the distribution is…
Q: Watch Corporation of Switzerland claims that its watches on average will neither gain nor lose time…
A:
Q: What is the clinical name of a probability that is used to determine the likelihood of someone…
A: We have to write the clinical names of indicated probabilities.
Q: %. The investor plans to sell the bo he second coupon payment is recei
A: Par Value of Bond is $1000 Coupon rate is 7.5% Yield is 5% Time to maturity is 5 years Bond is sold…
Q: Suppose a researcher collects x1,...,n i.i.d. measurements of the background radiation in Boston.…
A:
Q: Answer the following :question The marks of students in mathematics are normally distributed with a…
A:
Q: wants to estimate the mean HDL cholesterol of all 20- to 29-year-old females. How many subjects are…
A:
Q: A sample of five measurements, randomly selected from approximately normally distributed population,…
A: Given data : Significance level = 0.05 Sample size = 5 Sample mean = 5.6 Population mean = 8 Claim…
Q: PART II. The binomial distribution has p = 0.6 and n = 15. Find P(X> 8). Use pmf (with the MS…
A: Given: n = 15, p = 0.6 X ~ Bin(15, 0.6)
Q: QUESTION 12 Find the probability to obtain the sequence HTHT, when 4 coins are tossed one after…
A: We have to find the probability to obtain the sequence HTHT, when 4 coins are tossed one after…
Q: Use the bar graph below, which shows the highest level of education received by employees of a…
A: The bar graph for each of the level of education is given.
Q: A study was conducted to assess the effects of overcrowding on learning among elementary school…
A: Given Information: Not crowding: Sample size n1=45 Sample mean x¯1=80 Sample variance s12=90…
Q: a. Using 5% significance as the guide, interpret the pair-wise Granger causality. b. Draw the…
A: Note: As per guidelines we will solve the first question only, please repost other questions for…
Q: Given a normal distribution with a u 48 and o 4 find the z-score that corresponds to each x value…
A:
Q: An engineering enterprise can make profits of (500,000$, 700,000$, 680,000$, 10,000$, 440,000$)…
A: Solution: Let X represent the amount of engineering enterprise The values of X are 500000, 700000,…
Q: You cannot assume that a random sample taken from a population follows a normal distribution if the…
A: Answer:- Normal distribution:-
Q: The accompanying table shows results from regressions performed on data from a random sample of 21…
A:
Q: A Human Resource Trainer in a company claims that a trained workers should be able to finish an…
A: A hypothesis which is tested for plausible rejection is called the Null Hypothesis (typically…

Step by step
Solved in 3 steps with 2 images

- Urban Travel Times Population of cities and driving times are related, as shown in the accompanying table, which shows the 1960 population N, in thousands, for several cities, together with the average time T, in minutes, sent by residents driving to work. City Population N Driving time T Los Angeles 6489 16.8 Pittsburgh 1804 12.6 Washington 1808 14.3 Hutchinson 38 6.1 Nashville 347 10.8 Tallahassee 48 7.3 An analysis of these data, along with data from 17 other cities in the United States and Canada, led to a power model of average driving time as a function of population. a Construct a power model of driving time in minutes as a function of population measured in thousands b Is average driving time in Pittsburgh more or less than would be expected from its population? c If you wish to move to a smaller city to reduce your average driving time to work by 25, how much smaller should the city be?The following data are from a random sample of 10 students who participated in a study undertaken to investigate the effect of sleep time (measured in average number of hours of sleep per night) on GPA (grade point average, measured on a 4-point scale). Student Sleep time GPA 1 7 3.28 2 9 3.16 3 8 3.75 4 6 2.50 5 4 2.45 6 8 2.91 7 7 3.53 8 6 3.02 9 3 2.30 10 8 3.48 a. Find the equation between GPA (y) as function of sleep time (x). b. What is the estimated GPA of a student who averages 5 hours of sleep per night? c. What is the coefficient of determination? *(no use EXCEL)The following observations are obtained from a random sample of 10 individuals: Individual x y 1 9.63 5.06 2 4.80 3.20 3 6.84 4.48 4 10.2 5.62 5 8.81 4.13 6 10.4 5.55 7 4.19 3.35 8 8.21 5.77 9 7.97 4.81 10 9.11 5.64 Run a t-linear regression test on this data. (HINT: make sure you copy the numbers correctly!) What are the appropriate null and alternative hypotheses? H0:r=0H1:r<0H0:r=0H1:r<0 H0:r=0H1:r≠0H0:r=0H1:r≠0 H0:ρ=0H1:ρ<0H0:ρ=0H1:ρ<0 H0:r=0H1:r>0H0:r=0H1:r>0 H0:ρ=0H1:ρ≠0H0:ρ=0H1:ρ≠0 H0:ρ=0H1:ρ>0H0:ρ=0H1:ρ>0 What is the correlation coefficient? Round to 4 decimals. What is the coefficient of determination? Round to 4 decimals. Calculate the value of the test statistic. Round your response to at least 2 decimal places. |t||t|= What is the corresponding P-value for the test…
- Listed below are amounts of strontium-90 (in millibecquerels, or mBq) in a simple random sample of baby teeth obtained from residents in a region born after 1979. Use the given data to construct a boxplot and identify the 5-number summary. 126 127 130 134 135 137 140 142 144 145 147 147 148 151 152 155 157 157 159 164 Question content area bottom Part 1 The 5-number summary is enter your response here, enter your response here, enter your response here, enter your response here, and enter your response here, all in mBq. (Use ascending order. Type integers or decimals. Do not round.)In an experiment to determine the effect of ambient temperature on the emissons of oxides of nitrogen ( NOx ) of diesel trucks, 10 trucks were run at temperatures of 40°F and 80°F . The emissions, in parts per billion, are presented in the following table. Truck 40°F 80°F 1 926.5 896.7 2 851.1 857.0 3 975.5 952.1 4 1009.3 884.8 5 871.8 840.7 6 949.2 885.1 7 1006.3 885.5 8 836.5 777.8 9 837.8 850.2 10 958.9 882.1 Send data to Excel Let μ1 represent the mean emission at 40°F and =μd−μ1μ2 .Can you conclude that the mean emission differs between the two temperatures? Use the =α0.05 level of significance and the TI-84 Plus calculator to answer the following. p value ? do we reject? is there enough evidence :?A researcher wishes to study the relationship between education and income separately for individuals who have college degrees, and for those who don't. To this end, he interviews 100 individuals in each category. Survey results are listed in the table below. non college graduates college graduates avg education 13 yr 18 yr std. dev. education 2 yr 1.2 yr Sxx 396 yr2 143 yr2 Avg. Income $67,200 $84,950 std. dev. income $9,400 $10,500 correlation coefficient .25 .15 a. Use the data above to find point estimates for regression coefficients B0NG and B1NG for non-college graduates and BoG and B1G for college graduates. b. Propose an unbiased estimator for the difference theta=B1G - B1NG in slope coefficients for the two sub-populations, and show that B(theta hat)= 0. c. Assume that the error terms ENG and EG for non-graduates and graduates, respectively, are both distributed normally, with known standard deviation oENG = oEG = $ 10,000. In that case, determine the…
- In an ongoing nationwide survey, a question asked is whether a respondent favors or opposes capital punishment (the death penalty) for persons convicted of murder. The output for this exercise compares the proportions who said that they were opposed to the death penalty in the year 2008 and the year 1993. Sample X N Sample p 2008 637 1912 0.333 1993 333 1418 0.235 Estimate for p(1) − p(2): 0.098 95% CI for p(1) − p(2): (0.068, 0.129) (a) What proportion of the year 2008 sample was opposed to the death penalty? (Round your answer to three decimal places.) What proportion of the year 1993 sample was opposed? (Round your answer to three decimal places.) (b) What is the estimated difference between the proportions opposed to the death penalty in the 2 years? (Use p2008 − p1993. Round your answer to three decimal places.) (c) Write the 95% confidence interval as it is given in the output. to Interpret this interval in the context of this situation. There is a…A researcher is interested in testing the relationship between smoking and BMI (kg/m2) in adults aged 30-45. In order to test this association, the researcher divides smoking into currently more than a pack a day, currently less than a pack a day, and never smokers. The following table represents the BMIs for each participant enrolled by their respective smoking category. Current Smoker (≥1pack/day) Current Smoker (<1 pack/day Never Smoked 26.7 29.4 22.1 29.4 28.6 30.4 24.3 27.4 21.3 28.4 23.2 26.4 21.6 20.1 19.7 27.4 20.6 19.8 26.8 19.7 21.6 36.4 19.6 22.3 31.5 21.6 24.3 27.4 21.5 *Continue as though all assumptions for ANOVA are met. A) Calculate the MSW and MSB for the data represented above. B) Carry out a formal test for a one-way analysis of variance among the groups and interpret your results.rofessor Cornish studied rainfall cycles and sunspot cycles. (Reference: Australian Journal of Physics, Vol. 7, pp. 334-346.) Part of the data include amount of rain (in mm) for 6-day intervals. The following data give rain amounts for consecutive 6-day intervals at Adelaide, South Australia. 7 28 7 1 69 3 1 4 22 7 16 4 54 160 60 73 27 3 3 1 7 144 107 4 91 44 1 8 4 22 4 59 116 52 4 155 42 24 11 43 3 24 19 74 26 63 110 39 34 71 52 39 8 0 15 2 14 9 1 2 4 9 6 10 (i) Find the median. (Use 1 decimal place.)(ii) Convert this sequence of numbers to a sequence of symbols A and B, where A indicates a value above the median and B a value below the median. Test the sequence for randomness about the median at the 5% level of significance. (b) Find the number of runs R, n1, and n2. Let n1 = number of values above the median and n2 = number of values below the median. R n1 n2 (c) In the case, n1 > 20, we cannot use Table 10 of Appendix II to find the critical…
- An article reported data from a study in which both a baseline gasoline mixture and a reformulated gasoline were used. Consider the following observations on age (yr) and NOx emissions (g/kWh): Engine 1 2 3 4 5 6 7 8 9 10 Age 0 0 2 11 7 16 9 0 12 4 Baseline 1.70 4.38 4.06 1.24 5.29 0.59 3.35 3.45 0.73 1.22 Reformulated 1.86 5.91 5.51 2.70 6.50 0.71 4.95 4.86 0.72 1.41 Construct scatter plots of the baseline NOx emissions versus age. What appears to be the nature of the relationship between these two variables? There is no compelling relationship between the data. As age increases, emissions also increase. As age increases, emissions decrease.Listed below are amounts of strontium-90 (in millibecquerels, or mBq) in a simple random sample of baby teeth obtained from residents in a region born after 1979. Use the given data to construct a boxplot and identify the 5-number summary. 129 132 135 140 141 145 148 151 154 157 159 159 161 164 165 170 173 173 175 182 The 5-number summary is nothing, nothing, nothing, nothing, and nothing, all in mBq. (Use ascending order. Type integers or decimals. Do not round.)A blood pressure measurement consists of two numbers: the systolic pressure, which is the maximum pressure taken when the heart is contracting, and the diastolic pressure, which is the minimum pressure taken at the beginning of the heartbeat. Blood pressures taken at rest were measured, in millimeters, for a sample of 15 adults. The following table presents the results. Systolic 134 115 113 123 119 118 130 116 133 112 107 110 105 157 154 Diastolic 87 83 77 77 69 88 76 70 91 75 71 74 66 103 94 Below is a scatterplot of the data set. (a) Suppose we want to use systolic blood pressure to predict diastolic blood pressure. The explanatory variable is diaslostic blood pressure and the response variable is systolic blood pressure. (b) Describe the form, direction, and strength of the relationship: Form (Linear or Non-Linear) Linear Direction (Positive or Negative) Positive Strength (Weak or Moderate or Strong) Moderate (c) Find the value of the correlation…
