a. Using 5% significance as the guide, interpret the pair-wise Granger causality. b. Draw the DIAGRAM FORM by showing clearly the causality directions as either uni-directional or bi-directional.
a. Using 5% significance as the guide, interpret the pair-wise Granger causality. b. Draw the DIAGRAM FORM by showing clearly the causality directions as either uni-directional or bi-directional.

MATLAB: An Introduction with Applications
6th Edition
ISBN:9781119256830
Author:Amos Gilat
Publisher:Amos Gilat
Chapter1: Starting With Matlab
Section: Chapter Questions
Problem 1P

Related questions
Question
a. Using 5% significance as the guide, interpret the pair-wise Granger causality.
b. Draw the DIAGRAM FORM by showing clearly the causality directions as either
uni-directional or bi-directional.
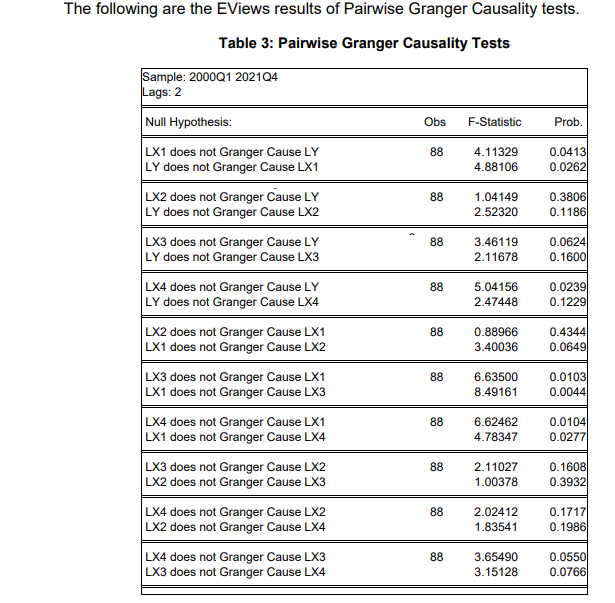
Transcribed Image Text:The following are the EViews results of Pairwise Granger Causality tests.
Table 3: Pairwise Granger Causality Tests
Sample: 2000Q1 2021Q4
Lags: 2
Null Hypothesis:
LX1 does not Granger Cause LY
LY does not Granger Cause LX1
LX2 does not Granger Cause LY
LY does not Granger Cause LX2
LX3 does not Granger Cause LY
LY does not Granger Cause LX3
LX4 does not Granger Cause LY
LY does not Granger Cause LX4
LX2 does not Granger Cause LX1
LX1 does not Granger Cause LX2
LX3 does not Granger Cause LX1
LX1 does not Granger Cause LX3
LX4 does not Granger Cause LX1
LX1 does not Granger Cause LX4
LX3 does not Granger Cause LX2
LX2 does not Granger Cause LX3
LX4 does not Granger Cause LX2
LX2 does not Granger Cause LX4
LX4 does not Granger Cause LX3
LX3 does not Granger Cause LX4
Obs
88
88
88
88
88
88
88
88
88
88
F-Statistic
4.11329
4.88106
1.04149
2.52320
3.46119
2.11678
5.04156
2.47448
0.88966
3.40036
6.63500
8.49161
6.62462
4.78347
2.11027
1.00378
2.02412
1.83541
3.65490
3.15128
Prob.
0.0413
0.0262
0.3806
0.1186
0.0624
0.1600
0.0239
0.1229
0.4344
0.0649
0.0103
0.0044
0.0104
0.0277
0.1608
0.3932
0.1717
0.1986
0.0550
0.0766
Expert Solution
This question has been solved!
Explore an expertly crafted, step-by-step solution for a thorough understanding of key concepts.

Step by step
Solved in 5 steps

Recommended textbooks for you
MATLAB: An Introduction with Applications
Statistics
ISBN:
9781119256830
Author:
Amos Gilat
Publisher:
John Wiley & Sons Inc

Probability and Statistics for Engineering and th…
Statistics
ISBN:
9781305251809
Author:
Jay L. Devore
Publisher:
Cengage Learning

Statistics for The Behavioral Sciences (MindTap C…
Statistics
ISBN:
9781305504912
Author:
Frederick J Gravetter, Larry B. Wallnau
Publisher:
Cengage Learning
MATLAB: An Introduction with Applications
Statistics
ISBN:
9781119256830
Author:
Amos Gilat
Publisher:
John Wiley & Sons Inc
Probability and Statistics for Engineering and th…
Statistics
ISBN:
9781305251809
Author:
Jay L. Devore
Publisher:
Cengage Learning
Statistics for The Behavioral Sciences (MindTap C…
Statistics
ISBN:
9781305504912
Author:
Frederick J Gravetter, Larry B. Wallnau
Publisher:
Cengage Learning

Elementary Statistics: Picturing the World (7th E…
Statistics
ISBN:
9780134683416
Author:
Ron Larson, Betsy Farber
Publisher:
PEARSON

The Basic Practice of Statistics
Statistics
ISBN:
9781319042578
Author:
David S. Moore, William I. Notz, Michael A. Fligner
Publisher:
W. H. Freeman

Introduction to the Practice of Statistics
Statistics
ISBN:
9781319013387
Author:
David S. Moore, George P. McCabe, Bruce A. Craig
Publisher:
W. H. Freeman