Use MATCH to find the year index for the "Year" in cell B20, and use INDEX to find the salesperson's performance during specified month in the highlighted box *** I need the excel formula/ function for YEAR INDEX C20 and SALES E20 ***
Use MATCH to find the year index for the "Year" in cell B20, and use INDEX to find the salesperson's performance during specified month in the highlighted box *** I need the excel formula/ function for YEAR INDEX C20 and SALES E20 ***

Practical Management Science
6th Edition
ISBN:9781337406659
Author:WINSTON, Wayne L.
Publisher:WINSTON, Wayne L.
Chapter13: Regression And Forecasting Models
Section: Chapter Questions
Problem 39P

Related questions
Question
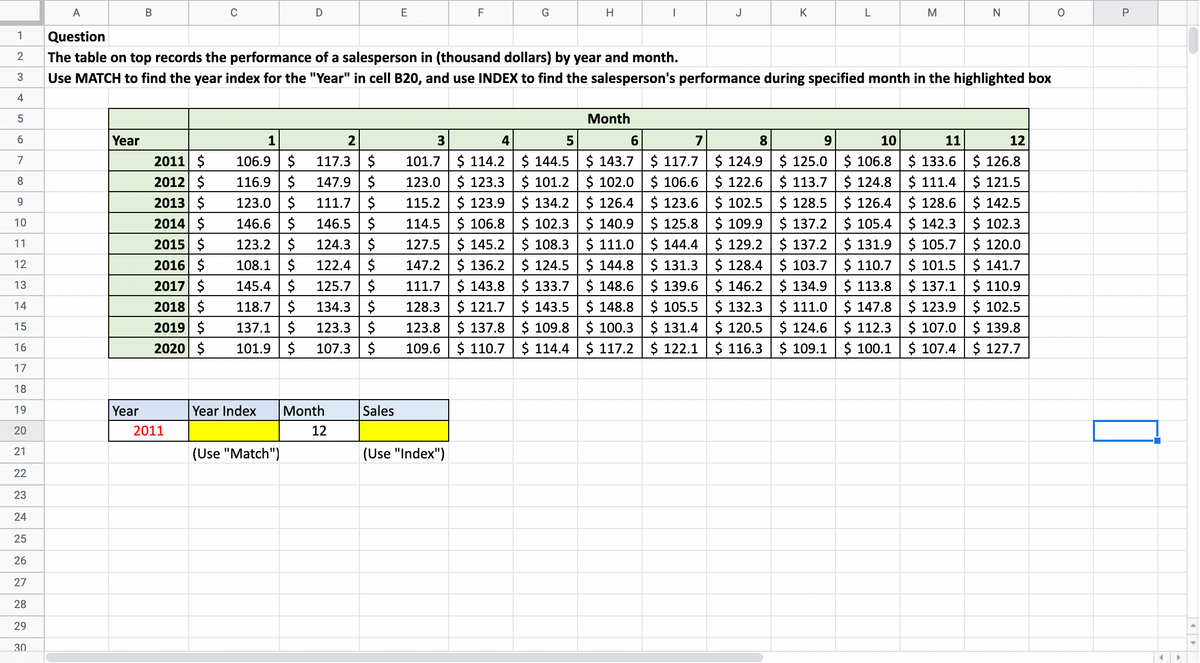
Use MATCH to find the year index for the "Year" in cell B20, and use INDEX to find the salesperson's performance during specified month in the highlighted box
*** I need the excel formula/ function for YEAR INDEX C20 and SALES E20 ***
Transcribed Image Text:1
2
3
4
5
6
7
600
8
9
10
11
12
13
14
15
16
17
18
19
20
21
22
23
24
25
26
27
28
29
30
Year
B
Year
A
Question
The table on top records the performance of a salesperson in (thousand dollars) by year and month.
Use MATCH to find the year index for the "Year" in cell B20, and use INDEX to find the salesperson's performance during specified month in the highlighted box
2011 $
2012 $
2013 $
2014 $
2015 $
2016 $
2017 $
2018 $
2019 $
2020 $
C
2011
1
106.9 $
116.9 $
123.0 $
146.6 $
D
2
117.3 $
147.9 $
111.7 $
146.5 $
124.3 $
122.4 $
123.2 $
108.1 $
145.4 $
125.7 $
118.7 $
134.3 $
137.1 $
123.3 $
101.9 $ 107.3 $
Year Index Month
12
(Use "Match")
Sales
E
(Use
F
dex")
G
5
3
101.7 $114.2
123.0 $ 123.3
115.2 $ 123.9
114.5 $106.8
127.5 $ 145.2
147.2 $136.2
111.7 $ 143.8
128.3 $ 121.7
123.8 $ 137.8
$ 144.5
$ 101.2
$ 134.2
$ 102.3
$108.3
$ 124.5
$ 133.7
$143.5
$ 109.8
109.6 $110.7 $ 114.4
4
H
Month
I
6
$ 143.7
$ 102.0
$126.4
$ 140.9
$111.0
$144.8
$ 148.6
$ 148.8
$ 100.3
$117.2
J
7
$ 117.7
$ 106.6
$ 123.6
$ 125.8
$144.4
$ 131.3
$ 139.6
$ 105.5
$ 131.4
$ 122.1
8
K
$ 124.9
$ 122.6
$ 102.5
$109.9
$ 129.2
$ 128.4
$ 146.2
$132.3
$ 120.5
$ 116.3
L
M
9
10
$125.0 $ 106.8
$ 113.7 $ 124.8
$128.5 $ 126.4
$137.2 $ 105.4
$137.2 $ 131.9
$103.7 $110.7
$ 134.9 $ 113.8
$111.0 $ 147.8
$ 124.6 $ 112.3
$ 109.1 $ 100.1
N
11
$ 133.6
$ 111.4
$ 128.6
$ 142.3
$ 105.7
$ 101.5
$137.1
$ 123.9
$107.0
$107.4
12
$126.8
$ 121.5
$ 142.5
$ 102.3
$120.0
$141.7
$ 110.9
$ 102.5
$ 139.8
$ 127.7
O
P
4
▸
Expert Solution
This question has been solved!
Explore an expertly crafted, step-by-step solution for a thorough understanding of key concepts.

This is a popular solution!

Trending now
This is a popular solution!

Step by step
Solved in 2 steps with 2 images

Recommended textbooks for you
Practical Management Science
Operations Management
ISBN:
9781337406659
Author:
WINSTON, Wayne L.
Publisher:
Cengage,
Practical Management Science
Operations Management
ISBN:
9781337406659
Author:
WINSTON, Wayne L.
Publisher:
Cengage,