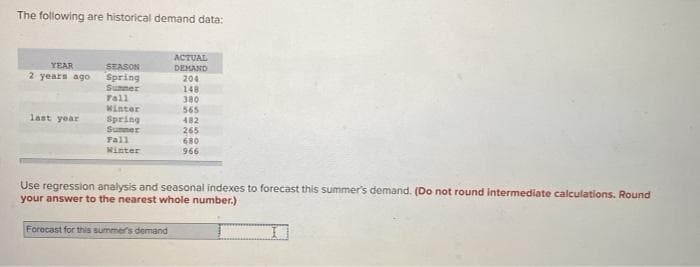
Use regression analysis and seasonal indexes to forecast this summer's demand. (Do not round Intermediate calculations. Round your answer to the nearest whole number.) Forecast for this summer's demand


Q: Year Record time (minutes) 2011 20 2012 26 2013 29 2014 28 2015 29 According to the table, when was…
A: We can see this in the table that from 2013 to 2014,the course time is decreasing by 1 second and…
Q: 4. From the regression equation, what is the predicted current stock price (in dollars) when the…
A: Given: Regression data to find: predicted current stock price when the earnings per share is 57.34$…
Q: According to the World Bank (Source: http://data.worldbank.org/indicator/…
A: Given, Total number of mobile phone subscription in 2008 = 4,028,070,041 Total number of mobile…
Q: Problem: If the price of commodity doubles in a period of 4 years, what is the average percentage…
A:
Q: Assume the geometric mean of 6 profit growth ratios of a company is 1.2. What is the product of…
A: Consider a set of numbers x1, x2, …, xn of size n.
Q: Exponential smoothing method uses only the most recent data (actual and forecast values of the…
A: 1.True
Q: The Bayside Fountain Hotel is adjacent to County Coliseum, a 24,000- seat arena that is home to the…
A: The given data is: .
Q: A regional rail company wants to reduce its delays. Presently, 70 percent of the trainsarrive on…
A: Option A is correct.
Q: For the Hawkins Company, the monthly percentages of all shipments received on time over the past 12…
A: The Moving average forecast of order k is obtained by the formula- Ft+1=Ft+Ft-1+...+Ft-k+1k The…
Q: What if you could predict one what your monthly income (USD) would be after graduation from the…
A:
Q: If an asset declines in value from $5000 to $3500 over nine years, what is the mean annual growth…
A: The mean annual growth rate is calculated using the formula r=PresentPast1n-1×100
Q: The accompanying dataset provides the closing prices for four stocks and the stock exchange over 12…
A: From the given information, the data values are, A 128.71 125.03 125.44 127.14 128.53…
Q: Sam Steward is a freelance Web page designer. Listed are his yearly wages between 2015 and 2018.…
A: Index numbers are used to understand the level of changes for the level of particular changes over a…
Q: A hypothetical country with a population of 20,000 people annually experiences 2000 births, 1700…
A: Given; Population Size=20,000Number of births=2000Number of deaths=1700Number of…
Q: Actual demand for the past 16 periods is shown below. Prepare a trend adjusted exponential smoothing…
A: Given information ɑ = 0.4 , β = 0.2, TAF5 = 729.33, T5 = 2.33 Unadjusted Forecast St = TAFt + ɑ (At…
Q: The forecast for week 13 is
A: Given, Period 1 2 3 4 5 6 7 8 9 10 11 12 Sales 617 617 648…
Q: Explain a general mathematical modeling to growth of Human population. And what will be the Iraq…
A:
Q: What is the average growth in average sales per agent per month from March to May target? *
A: Here given chart of 2016 sales in different categories And no of transaction agent per month also…
Q: A pizza chain has had sales for take-out food over the last four evenings—Monday, Tuesday,…
A: Friday forecast using Exponential smoothing with Alpha = 0.20: In the exponential smoothing method,…
Q: Compare a three-month moving average forecast with the exponential smoothing forecast for a = 0.3.…
A: b) Three month moving average: 3-month moving average=sum of the 3 consequent values3…
Q: Based on the scatterplot and computer output, a reasonable estimate for the stock price for week 95…
A: Given: An exponential model is created for estimating the stock price based on the number of weeks…
Q: a. Calculate the regression equation that predicts price per share based on the annual dividend.…
A: a. The regression equation is Price = 27.0154 + 2.4082 dividend
Q: A helpline usually gets 4 phone calls per hour. Assume that the number of phone calls is…
A:
Q: Year Simple Index 2010 2011 2012 2013 2014 2015 2016 2017 2018 Interpret the trend in the number of…
A: a. The formula to use the simple index: Simple Index = P1P0×100, here, P1= current year, P0= base…
Q: Sales of a particular product for the years 2017 through 2020 have been 47,150, 52,477, 64,750 and…
A: Given- Sales of a particular product for the years 2017 through 2020 have been 47,150, 52,477,…
Q: tic, exponential using first differences, second differences and growth or decay factor?Give reasons…
A: Year No. of Businesses with websites 2000 256 2001 287 2002 317 2003 341 2004 368 2005…
Q: For the data given, use the arithmetic average of the first six months of data as a baseline to…
A: a.
Q: During periods when the unadjusted federal minimum wage is constant identify the trend .
A: The minimum wage needs to be fixed based on Employment growth rather than employment levels. The…
Q: A researcher collects medical records from doctors who choose to prescribe one of two types of…
A: There are so many research studies we conduct in analysis, experimental study, observational study,…
Q: Given an actual demand this period of 103, a forecast value for this period of 99, and an alpha of…
A:
Q: [Q14) Another analyst obtained predictions using exponential smoothing (note that some values are…
A: The exponential smoothening forecast using can be obtained by the formula- Ft+1=αYt+1-αFt
Q: The price of oil was steadily increasing by 3% a year for a 10-year period. The cause was general…
A: Given that, The price of oil was steadily increasing by 3% a year for a 10-year period. The cause…
Q: Use the MA3 method (moving average 3 periods) to forecast enrollment in Spring 2022 Use…
A: a) Data : Year Season Data 2020 Spring 131 2020 Summer 16 2020 Fall 17 2021 Spring 125…
Q: If an asset declines in value from $5,000 to $3,500 over eight years, what is the mean annual growth…
A: From the provided information, Present value = $5,000 Future value = $3,500 Time (n) = 8 years
Q: A convenience store recently started to carry a new brand of soft drink. Management is interested in…
A: Given Data : Period / week Sales 1 572 2 637 3 648 4 740 5 670 6 633 7 752 8 690…
Q: Use the model to estimate the profit in 1978
A: Let Y represent the profit (or loss) for a certain company X years after 1970. Based on the data…
Q: Explain (give an example for each) cyclical, frictional, and structural unemployment?
A: Cyclical unemployment arise due to the economic up and downs. For example; the unemployment during…
Q: Use the model to predict the percentage of female high school graduates in 2029. Round to the…
A: When we want to estimate an impact of many variables on the one variable at that time we…
Q: Enrollment in a particular class over the past few semesters has been forecast using an exponential…
A:
Q: Using CAGR
A: TRUE OR FALSE
Q: The life expectancies of black males in the United States at various ages for 2006 are as shown…
A: a) At birth age=0 So coordinate are (0,69.7) and (60,18.2). We find the average rate of change…
Q: A house sells for $81528 at the end of 2010 and for $161637 at the end of 2017. If the market…
A:
Q: Define the three logarithmic regression models? Explain how Logarithms and percentages are inter…
A: Linear regression can generally be represented either with natural log as coefficient or by real…
Q: What is the formula for calculating growth rate?
A: The formula of the growth rate is defined as:
Q: Suppose that a firm's sales were $3,750,000 five years ago and are $5,250,000 today. What was the…
A: Geometric Mean Growth Rate Future Value, FV = E ( 1 + r / 100) ^ n
Q: Nelson invested $100 at 5% interest compounded annually. Which of the following data tables…
A: The invested at time t years when rate of interest is compounded annually is given by:
Q: Use the model to predict the percentage of female high school graduates in 2024. Round to the…
A:
Q: The accompanying dataset provides the closing prices for four stocks and the stock exchange over 12…
A: Given information: The time series data is given.


Trending now
This is a popular solution!

Step by step
Solved in 2 steps


- Find the equation of the regression line for the following data set. x 1 2 3 y 0 3 4The following are historical demand data: YEAR SEASON ACTUALDEMAND 2 years ago Spring 205 Summer 151 Fall 379 Winter 560 last year Spring 481 Summer 268 Fall 679 Winter 959 Use regression analysis on deseasonalized demand to forecast next summer’s demand. (Round your answer to the nearest whole number.)The following are historical demand data: YEAR SEASON ACTUAL DEMAND 2 years ago Spring 205 Summer 140 Fall 375 Winter 575 last year Spring 475 Summer 275 Fall 685 Winter 965 Use regression analysis and seasonal indexes to forecast this summer’s demand. Note: Do not round intermediate calculations. Round your answer to the nearest whole number.
- Apply the 3-years moving average method to forecast the required demand for the year 2021from the following historical data.Years 2012 2013 2014 2015 2016 2017 2018 2019 2020Demand 245 325 300 350 295 400 450 380 500Given the following data for demand at the XYZ Company, calculate the monthly forecast for 2003 using a 3-month moving average. Calculate the Forecast, Error, MAD (mean absolute percentage error), Bias and the TS (tracking signal) .Consider the following data:Monthly Profit of a Gym: Month & Profit: Jan-12: 5700 Feb-12: 5453 March-12: 5034 April-12: 4717 May-12: 5185 June-12: 5638 July-12: 6519 Aug-12: 6182 Sept-12: 5913 What are the MAD, MSE and MAPE scores for the three-period weighted moving average forecast? Round any intermediate calculations, if necessary, to no less than six decimal places, and round your final answer to one decimal place. MAD: MSE: MAPE as %: link to excel sheet for forumla to assist: http://www.livebinders.com/play/play?id=2368073
- The demand and forecast information for the XYZ Company over a twelve-month period has been collected in the Microsoft Excel Online file below. Use the Microsoft Excel Online file below to develop forecast accuracy and answer the following questions. Forecast Accuracy Measures Period Actual Demand Forecast Error Absolute Error Error^2 Abs. % Error 1 1,300 1,378 2 2,000 1,676 3 1,800 1,974 4 1,700 2,272 5 2,300 2,570 6 3,800 2,868 7 3,200 3,166 8 3,100 3,464 9 3,900 3,761 10 4,600 4,059 11 4,200 4,357 12 4,300 4,655 Total Average RSFE MAD MSE MAPE Tracking Signal 1. What can be concluded about the quality of the forecasts? Assume that the control limit for the tracking signal is ±3. The results indicate (bias or no bias) in the…The problem is based on the following data given. Observations of the demand for a certain part stocked at a parts supply depot during the calendar year 2013 were ( as shown ). Using a four-month moving average, determine the two-step-ahead forecast for July through December 2013. (Hint: The two-step-ahead forecast for July is based on the observed demands in February through May.)Given the following data and seasonal index: Month Sales Year 1 Year 2 Jan 8 8 Feb 7 9 Mar 5 6 Apr 10 11 May 9 12 June 12 16 July 15 20 Aug 20 25 Sept 4 4 Oct 3 2 Nov 8 7 Dec 9 9 (a) Compute the seasonal index using only year 1 data. (b) Determine the deseasonalized demand values using year 2 data and year 1's seasonal indices.
- Given the following demand for ten-period time frame as shown in the table below. Compute the three-period and five-period moving average forecasts. Plot the actual demand and the forecasts on the same graph. Period 1 2 3 4 5 6 7 8 9 10 Demand (in units) 24 25 28 32 35 38 41 46 49 53 Forecast Table: Period Actual 3-Moving Averages 5-Moving Averages 1 24 2 25 3 28 4 32 5 35 6 38 7 41 8 46 9 49 10 53 11Observations of the demand for a certain part stocked at a parts supply depot during the calendaryear 2013 were: Month Demand Month Demand Jan 89 july 223 Feb 57 august 286 mar 144 sept 212 april 221 oct 275 may 177 nov 188 june 280 dec 312 a) Using a four-month moving average, determine the one-step-ahead forecast for Julythrough December 2013.b) Using a four-month moving average, determine the two-step-ahead forecast for Julythrough December 2013.c) Obtain the MAD for the forecasts obtained in the above sections. Which method gavebetter results? Based on forecasting theory, which method should have given betterresults?The customer demand for a particular smart phone during Year 0 to Year 5 is given as 1,056,000, 1,032,000, 1,093,000, 1,024,000, 1,066,000, and 1,072,000. Using the Holt forecasting model with trend, what is the forecasted demand in year 10, where w = 0.4 and v = 0.5?a) 1,071,874b) 1,075,573c) 1,077,488d) 1,083,816