USE TABLE #1: Now, assume the market for electric automobiles is an efficient market. The producer surplus for the market for electric automobiles is $ - (Remember to use a comma, if a comma is needed and to include the decimal point and two numbers to the right of the decimal point). USE TABLE #1: The calculation you used to find the producer surplus for the efficient market for electric automobiles is 1/2 x ($ - 24 )x( ). (Remember to use a comma, if a comm is needed and to include the decimal point and two numbers to the right of the decimal point).
USE TABLE #1: Now, assume the market for electric automobiles is an efficient market. The producer surplus for the market for electric automobiles is $ - (Remember to use a comma, if a comma is needed and to include the decimal point and two numbers to the right of the decimal point). USE TABLE #1: The calculation you used to find the producer surplus for the efficient market for electric automobiles is 1/2 x ($ - 24 )x( ). (Remember to use a comma, if a comm is needed and to include the decimal point and two numbers to the right of the decimal point).

Chapter19: Using Economics To Understand The World Around You
Section: Chapter Questions
Problem 9E: The United States government subsidizes many so-called green companies. For instance, it has given...

Related questions
Question
please solve both a and b to the question
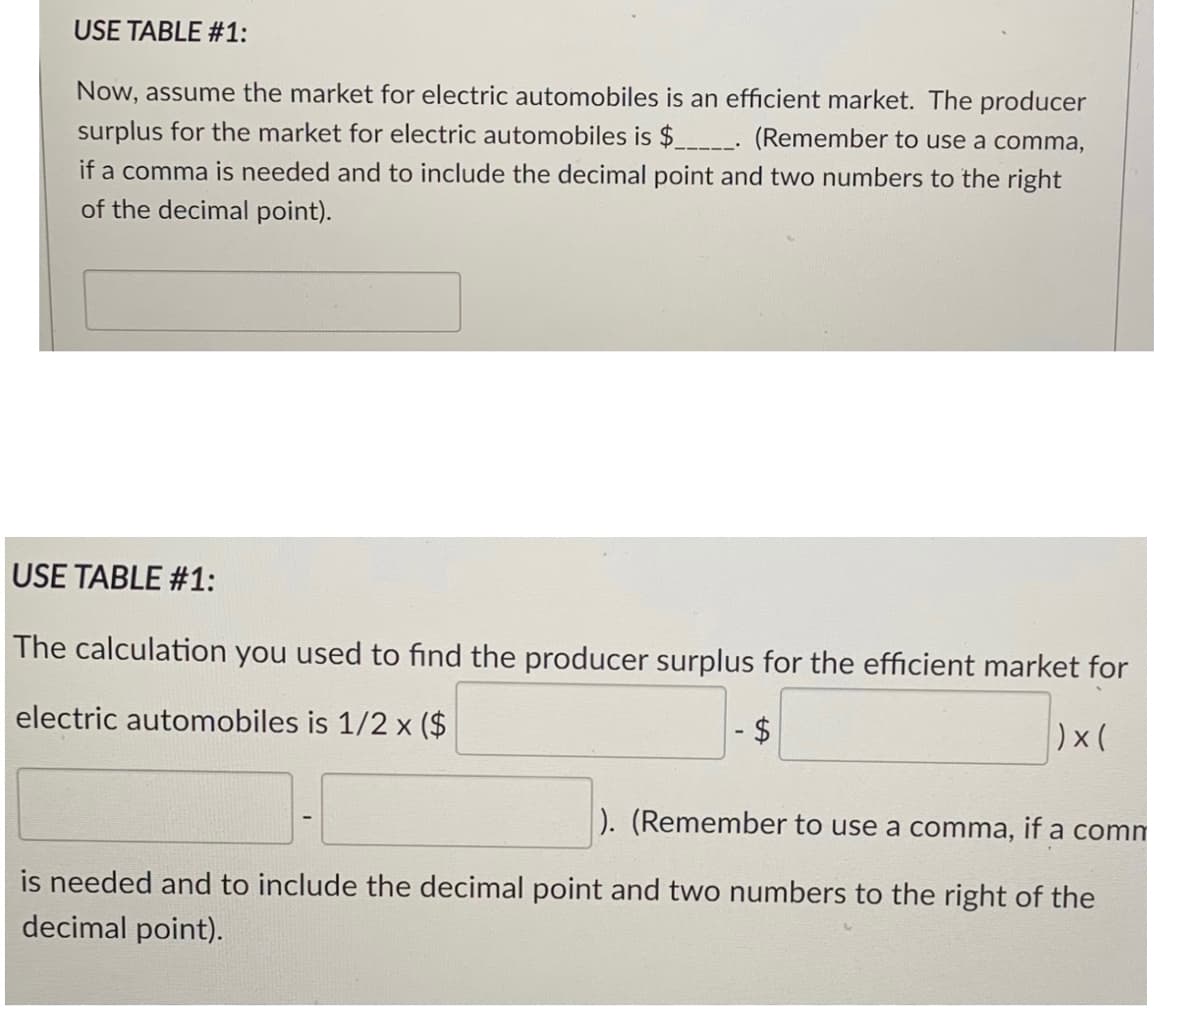
Transcribed Image Text:USE TABLE #1:
Now, assume the market for electric automobiles is an efficient market. The producer
surplus for the market for electric automobiles is $___- (Remember to use a comma,
if a comma is needed and to include the decimal point and two numbers to the right
of the decimal point).
USE TABLE #1:
The calculation you used to find the producer surplus for the efficient market for
electric automobiles is 1/2 x ($
$4
)x(
). (Remember to use a comma, if a comm
is needed and to include the decimal point and two numbers to the right of the
decimal point).
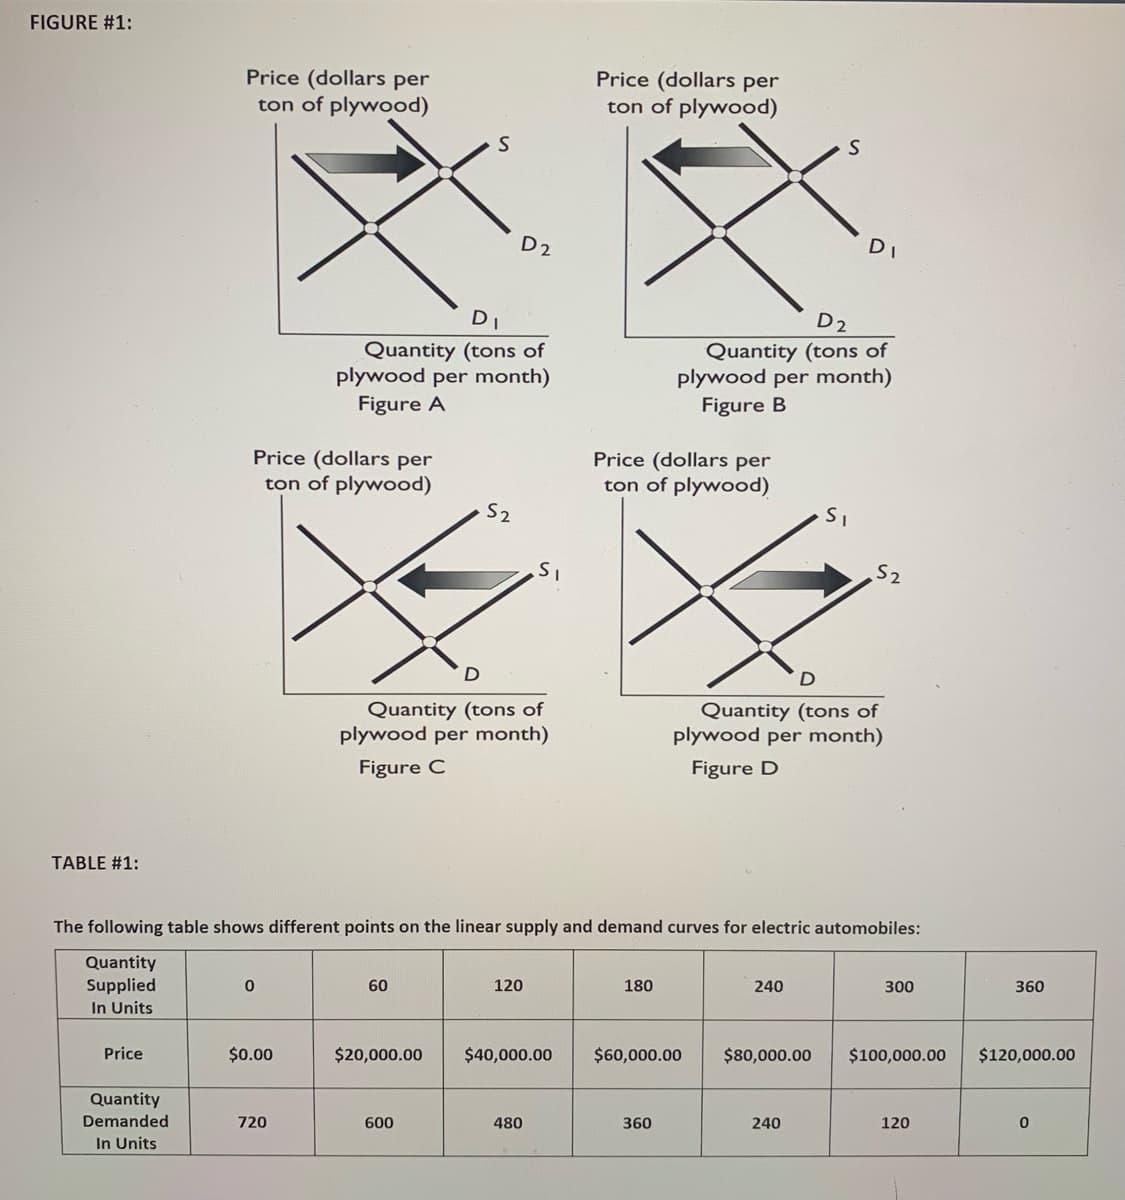
Transcribed Image Text:FIGURE #1:
Price (dollars per
Price (dollars per
ton of plywood)
ton of plywood)
D2
DI
D
D2
Quantity (tons of
plywood per month)
Figure A
Quantity (tons of
plywood per month)
Figure B
Price (dollars per
ton of plywood)
Price (dollars per
ton of plywood)
S2
S2
D
Quantity (tons of
plywood per month)
Quantity (tons of
plywood per month)
Figure C
Figure D
TABLE #1:
The following table shows different points on the linear supply and demand curves for electric automobiles:
Quantity
Supplied
In Units
60
120
180
240
300
360
Price
$0.00
$20,000.00
$40,000.00
$60,000.00
$80,000.00
$100,000.00
$120,000.00
Quantity
Demanded
720
600
480
360
240
120
In Units
Expert Solution
This question has been solved!
Explore an expertly crafted, step-by-step solution for a thorough understanding of key concepts.

Step by step
Solved in 2 steps with 1 images

Knowledge Booster


Learn more about
Need a deep-dive on the concept behind this application? Look no further. Learn more about this topic, economics and related others by exploring similar questions and additional content below.Recommended textbooks for you