USE THE 8-STEP HYPOTHESIS TESTING The following table shows the distribution of uric acid determinations taken on 250 patients. Test the goodness-of-fit of these data to a normal distribution with = 5.74 and o=2.01. Let α = .01. Uric Acid Determination <1 1 to 1.99 2 to 2.99 3 to 3.99 4 to 4.99 5 to 5.99 Total Observed Frequency 1 5 15 24 43 50 Uric Acid Determination 6 to 6.99 7 to 7.99 8 to 8.99 9 to 9.99 10 or higher Observed Frequency 45 30 22 10 5 250
USE THE 8-STEP HYPOTHESIS TESTING The following table shows the distribution of uric acid determinations taken on 250 patients. Test the goodness-of-fit of these data to a normal distribution with = 5.74 and o=2.01. Let α = .01. Uric Acid Determination <1 1 to 1.99 2 to 2.99 3 to 3.99 4 to 4.99 5 to 5.99 Total Observed Frequency 1 5 15 24 43 50 Uric Acid Determination 6 to 6.99 7 to 7.99 8 to 8.99 9 to 9.99 10 or higher Observed Frequency 45 30 22 10 5 250

Glencoe Algebra 1, Student Edition, 9780079039897, 0079039898, 2018
18th Edition
ISBN:9780079039897
Author:Carter
Publisher:Carter
Chapter10: Statistics
Section10.4: Distributions Of Data
Problem 19PFA

Related questions
Question
skip if you already did this and follow instructions
do 8 step process
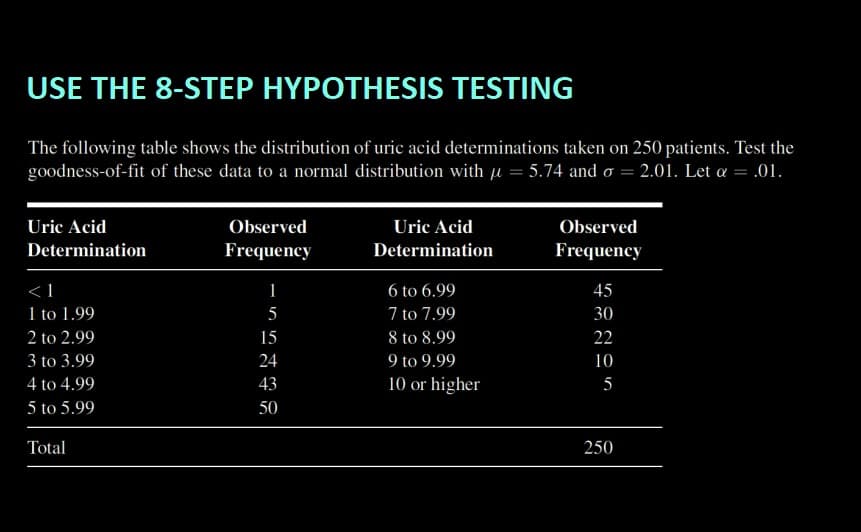
Transcribed Image Text:USE THE 8-STEP HYPOTHESIS TESTING
The following table shows the distribution of uric acid determinations taken on 250 patients. Test the
goodness-of-fit of these data to a normal distribution with = 5.74 and o=2.01. Let α = .01.
Uric Acid
Determination
<1
1 to 1.99
2
to 2.99
3 to 3.99
4 to 4.99
5 to 5.99
Total
Observed
Frequency
1
5
15
24
43
50
Uric Acid
Determination
6 to 6.99
7 to 7.99
8 to 8.99
9 to 9.99
10 or higher
Observed
Frequency
45
30
22
10
5
250
Expert Solution
This question has been solved!
Explore an expertly crafted, step-by-step solution for a thorough understanding of key concepts.

This is a popular solution!

Trending now
This is a popular solution!

Step by step
Solved in 2 steps

Recommended textbooks for you
Glencoe Algebra 1, Student Edition, 9780079039897…
Algebra
ISBN:
9780079039897
Author:
Carter
Publisher:
McGraw Hill
Glencoe Algebra 1, Student Edition, 9780079039897…
Algebra
ISBN:
9780079039897
Author:
Carter
Publisher:
McGraw Hill