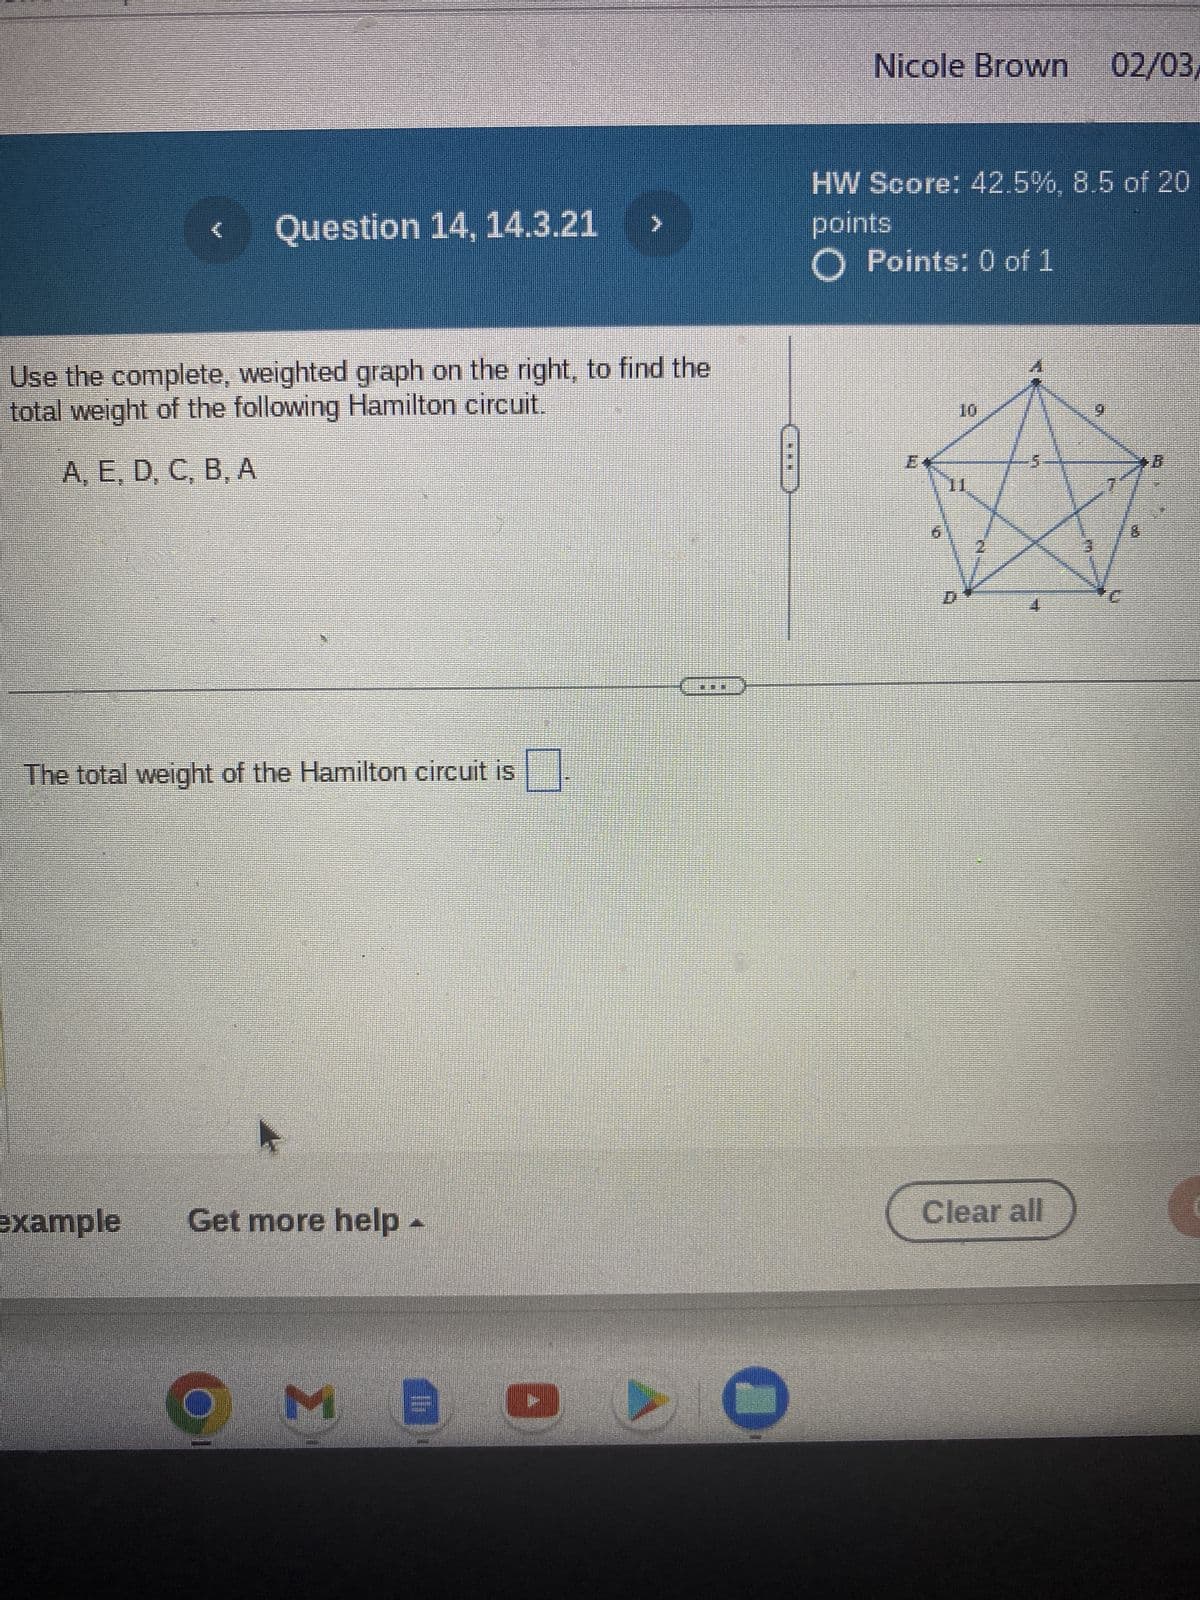
Use the complete, weighted graph on the right, to find the total weight of the following Hamilton circuit. A, E, D, C, B, A The total weight of the Hamilton circuit is ... E 10 11 D -5 4 9 C B


Q: Task-5. Draw Stem and Leaf Plots of the following sets of data. Data-1: 25, 101, 355, 463, 172, 441,…
A: Given information: The sets of different data are given.
Q: A researcher wants to compare the effectiveness of two different teaching methods on students' exam…
A: Given The data is as follows: Method A Method B 80 70 85 72 88 75 90 78 92 80 95 82…
Q: A manufacturer claims that the mean lifespan of their lightbulbs is at least 1000 hours. A sample of…
A: given data n = 25x¯ =990s = 50α = 0.01claim : μ ≥ 1000
Q: If the researcher summarizes interview content to capture key concerns, ideas, attitudes, etc., the…
A: TRUE
Q: Michelle, a telemarketer makes six phone calls per hour and is able to make a sale on 30% of these…
A: The random variable X is making sales. The number of cars per hour is 6. The probability of making a…
Q: Suppose now that the mean µ and standard deviation σ of this distribution are both unknown.…
A: With the general assumption, the distribution of driving speed of drivers in US is considered to be…
Q: In a particular bag of skittles, there are 9 red, 9 orange, 10 green, 12 yellow, and 15 purple…
A:
Q: Distribution is skewed right (b)When we compute the sample mean and sample standard deviation for…
A: Given: Sample mean x¯=36.56 Sample standard deviation s=4.475
Q: Assume that the readings at freezing on a batch of thermometers are normally distributed with a mean…
A:
Q: Suppose that the proportions of blood phenotypes in a particular population are as follows. A 0.41 B…
A: a) The proportions of blood phenotypes for blood groups A, B, AB and O are, P(A) = 0.41, P(B) =…
Q: #1 Fifty randomly selected adults who follow professional sports were asked to name their favorite…
A: The question is about frequency distribution Given : To find : a ) Freq. dist., relative freq.…
Q: a. What is the probability of finding oil (to 2 decimals)? 0.60 b. After 200 feet of drilling on the…
A: Given that, P(high-quality oil) = 0.45 P(medium-quality oil) = 0.15 P(no oil) = 0.40 P(soil |…
Q: Suppose the accompanying summary statistics for a measure of social marginality for samples of…
A:
Q: Find the mean median mode and range variance and standard deviation for the following data which…
A: Given The data is as follows: The weight of 15 basketball players on a college team 196, 188, 225,…
Q: I don't understand question a.
A: Here is the given bar graph of the population of the United States by race
Q: 2 Total biomass (g) of prairie plants growing in each of 20, 0.5 m² plots. Half of the plots" were…
A: ANSWER: The mean is a measure of central tendency that gives an idea of the standard values of a…
Q: Tourism is extremely important to the economy of Florida. Hotel occupancy is an often-reported…
A: given data n1 =1750 x1 = 1470p^1 = x1n1 = 14701750 = 0.8400 n2 = 1800 x2 = 1458 p^2 = x2n2 =…
Q: In a cognitive psychology experiment, the researcher is interested in whether encoding condition has…
A:
Q: What is the null hypothesis in a two-sample t-test for means, where sample 1 has size n1 = 20 and…
A: The null hypothesis in this case would be that the true mean difference between the two populations…
Q: Sketch the region corresponding to the statement P(z > 0.9) Shade: Left of a value ********* -4 -3…
A: Given that P(Z>0.9)
Q: Statistics is a bunch of numbers looking for a fight. Please advise if you agree or disagree and…
A: We have to given the explanation to the claim "Statistics is a bunch of numbers looking for a fight"
Q: A survey is conducted to understand the relationship between income and job satisfaction, what is…
A: Answer: The dependent variable in this scenario is the job satisfaction.
Q: Suppose we have three subgroups, and each subgroup consists of five samples drawn from the normal…
A: Given information: The three subgroups were drawn from Nμ,σ2, with each subgroup consists five…
Q: Let X and Y be two continuous random variables with joint probability density function f(x,y) = k(x…
A: X and Y be two continuous random variable with the joint probability density function f (x ,y ) then…
Q: The following table shows the total spent on research and development by industry in a country, in…
A: We have given data about the research and development industry spent amount in a country for period…
Q: An agriculture company wants to determine if a new fertilizer has a significant effect on crop…
A: We have given that, numerator degrees of freedom (df1) = 3 denominator degrees of freedom (df2) =…
Q: The first question is wrong, can you please provide that as a fraction?
A: We have given the following table Color Frequency blue 219 brown 151 green 144…
Q: Three Children Using the same sample space and assumption from Exercise 33, find the probability…
A: given data family with three children we represent boy as B and girl as G sample space :…
Q: A statistician wants to determine if there is a significant difference in the average height of male…
A: The null hypothesis is that there is no significant difference in the average height between males…
Q: 1.7 Fisher's irises: Sir Ronald Aylmer Fisher was an English statistician, evolutionary biologist,…
A: The data set contained sepal length and width, and petal length and width from three species of iris…
Q: The arrivals of patients at a walk-in clinic between 1:00 and 2:00 PM follows a Poisson process with…
A: As per our guidelines we are supposed to answer only 3 subparts of any questions so i am solving…
Q: fit to a data set with p predictor variables, and the adjusted R-squared value is 0.75. What can we…
A: Multiple regression model y = b0+b1x1+b2x2 Independent variables x1 and x2 Dependent variable y…
Q: An article in American Heart Journal ["Long-term survival after successful in-hospital cardiac…
A: The probability density function of X is f(x)=0.5e-0.5(x-3) for x>3.
Q: An experiment is conducted to see the effect of light intensity on plant growth, what is the…
A:
Q: The table shows the number of days on the market for the 36 recent home sales in the city of Sonando…
A: Given data indicates the number of days on the market for the 36 recent home sales in the city. The…
Q: The valid use of chi-square also requires that expected frequencies not be too small. Explain.
A: Introduction The χ2 test is a non-parametric test.
Q: CO 3) A puck company wants to sponsor the players with the 10% quickest goals in hockey games. The…
A: Given that Mean=M=8.54, Standard deviations=Sd=4.91 P(X<a)=10%=0.10
Q: The weight of a small Starbucks coffee is a normally distributed random variable with a mean of 380…
A: For the distribution of the weight (in grams) of coffee (which is distributed normally), it is given…
Q: Two samples are taken from different populations with the following sample means, sizes, and…
A: Given that Sample sizes n1=72 , n2=70 Sample mean=39 , 32 Standard deviation s1=5 , s2=4
Q: 1. We discussed Joe the Slow Tapper in class. The normal person taps 100 times in 20 seconds with a…
A: 1) Given Information: Mean μ=100 Standard deviation σ=20 The size of critical region is 20%
Q: Step 1. Hypotheses Set-Up: Ho: Select an answer Ha: Select an answer Step 2. The significance level…
A: Line 1 Line 2 100.7 101.6 104.7 100.4 101.9 102 101.6 97.6 98.9 99.9 101 99.1 100.3…
Q: A researcher wants to estimate the proportion of depressed individuals taking a new anti-depressant…
A: Given that: Sample size, n=250 Number of successes, x=202 Confidence level = 95%
Q: Textbook: Statistics for the Behavioral Sciences Gregory J. Privitera Please show your…
A: We have given that, The data set are, 2, 9, 2, 8, 2, 3, 1, 0, 5, 7 Then, We will find the sample…
Q: indly advise the purpose of each below for this particular event/game as how and why its important…
A: Game Winning Team Points Losing Team Points Total Points 1 SOUTH AFRICA 7S 34 CANADA 7S 5 39 2…
Q: Pleaze provide interpretations of the answers provided for each category listed below in the context…
A: Game Winning Team Points Losing Team points Total points 1 34 5 39 2 26 10 36 3 20 5 25 4 31…
Q: A box contains 10 balls, of which 5 are red and 5 are blue. Four balls are drawn randomly, without…
A: Given that: Total number of balls=10 Number of red balls = 5 Number of blue balls = 5
Q: #3 On January 11, 2005, the Gallup Organization released the results of a poll investigating how…
A: Introduction: It is required to draw bar chart and pie charts using Excel to display the given…
Q: Roads A, B, and C are the only way to escape from a certain provincial prison. Prison records show…
A:
Q: A sample of 100 observations from a normal population has a mean of 50 and a standard deviation of…
A: The test statistic for this hypothesis test is calculated as follows: z = (50 - 48) / (10 /…
Q: If the mean of the given frequency distribution is 35, then find the missing frequency y. Also,…
A: The data is given on the manufacturing time of batteries in hrs. Sample size (n) = 12 Let y be the…
Help


Trending now
This is a popular solution!

Step by step
Solved in 2 steps with 2 images

- Answer question #9. Show the graph of the rejection region.Based on the information on the image answer the following Question: 2- Represent the student's weights by suitable graphs (minimum 2 graphs).Question 2 Which graph has the largest value for b ? a.green b.orange c.black d.red e.blue Which graph has the smallest value for b? a.green b.orange c.black d.red e.blue which graph has the largest value for a ? a.blue b.black c.red d.green e.orange
- Match the numbers which are labled on the right side to the left side of the graphs. Matching questionFind the range of the three graphs shown above in part 4 of QuestionFor each of the scenarios in question 1 please determine: a) An acceptable domain and range b) The end behavior c) A sketch of the graph for each scenario I have question 1 answer below
- The FedEx delivery person has packages to deliver in State College, Bellefonte, Millheim, Spring Mills and Port Matilda.She will begin her tour at State College and end in Bellefonte. From a graph-theoretic point of view, this kind of problem requires one to find which of the following? Group of answer choices Euler circuit Hamilton circuit Euler path Hamilton path Euclid pathExamine the following figure, which displays hypothetical measurements of a sample of individuals from three groups. The horizontal axis represents three groups: A, B, and C. The vertical axis represents measurements from 0.0 to 10.0 with an interval of 2.5. The approximate data from graph are as follows: For group A, majority of measurements lie between 1 to 5 with widest bulge at 2 point 7. For group B, majority of measurements lie between 1 and 6 with the widest bulge at 2 point 5. For group C, majority of measurements lie between 2 point 5 and 7 with the widest bulge at 6 point 5. A) In which of the groups is the frequency distribution of measurements approximately symmetric? B) Which of the frequency distributions show negative skew? C) Which of the frequency distributions show positive skew?Question wants 8 classes starting from 1.24 - 1.27 and do on....grateful idea working out the olive graph. Thanks
- For which of the two situations below is it desirable to find an Euler circuit or an efficient eulerization of a graph I. After a storm, a health department worker inspects all the houses of a small village to check for damage. II. A veteran planning a visit to all the war memorials in Washington, D.C., plots a route to follow.NOTE: Blue = Central, Green = Eastern and Orange = Western. In the two graphs provided: Tell which region has the highest average in both graphs and the 2nd highest.The weight or cost of a path in a weighted graph is the sum of edge weights of a path. The shortest path from a vertex s to a vertex t is the least cost path from s to t. Given the graph below, which of the following path from s to t is the shortest path?
