Use the computer output to write the estimated linear regression equation for predicting Standing Reach from Wingspan. ŷ = Which of the following is the correlation coefficient for the linear relationship between Standing Reach and Wingspan? OA. 0.7753 OB. -0.8805 )C. -0.7753 D. 0.8805 Each additional 1 inch of Wingspan is associated with a(n) increase v of inches in Standing Reach.
Use the computer output to write the estimated linear regression equation for predicting Standing Reach from Wingspan. ŷ = Which of the following is the correlation coefficient for the linear relationship between Standing Reach and Wingspan? OA. 0.7753 OB. -0.8805 )C. -0.7753 D. 0.8805 Each additional 1 inch of Wingspan is associated with a(n) increase v of inches in Standing Reach.

Algebra & Trigonometry with Analytic Geometry
13th Edition
ISBN:9781133382119
Author:Swokowski
Publisher:Swokowski
Chapter7: Analytic Trigonometry
Section7.6: The Inverse Trigonometric Functions
Problem 94E

Related questions
Question
![Arnold fits a linear model to the data using the statistical software, R. A summary of that model fit is given below:
Coefficients
Estimate
Std Error
t value Pr( > [t])
(Intercept)
2.194
7.838
0.28
0.781
Wingspan
1.222
0.09497
12.869
3.55е-17
Residual standard error: 2.319 on 48 degrees of freedom
Multiple R-squared: 0.7753, Adjusted R-squared: 0.7706
1. Use the computer output to write the estimated linear regression equation for predicting Standing Reach from Wingspan.
ŷ =
+
2. Which of the following is the correlation coefficient for the linear relationship between Standing Reach and Wingspan?
OA. 0.7753
В. -0.8805
C. -0.7753
D. 0.8805
3. Each additional 1 inch of Wingspan is associated with a(n) increase
v of
inches in Standing Reach.
4. What is the expected Standing Reach if a player has a Wingspan of 0 inches?
5. The wingspan of Al-Farouq Aminu is 87.25 inches. Calculate the estimated value for the standing reach of Al-Farouq Aminu that is predicted by the
linear model.
Estimated value =](/v2/_next/image?url=https%3A%2F%2Fcontent.bartleby.com%2Fqna-images%2Fquestion%2F7322ac56-8006-425c-9e34-a782e9b1720e%2Fd8642c79-a5f2-440a-9511-30f7e7b5395e%2Fsy7t4wr_processed.png&w=3840&q=75)
Transcribed Image Text:Arnold fits a linear model to the data using the statistical software, R. A summary of that model fit is given below:
Coefficients
Estimate
Std Error
t value Pr( > [t])
(Intercept)
2.194
7.838
0.28
0.781
Wingspan
1.222
0.09497
12.869
3.55е-17
Residual standard error: 2.319 on 48 degrees of freedom
Multiple R-squared: 0.7753, Adjusted R-squared: 0.7706
1. Use the computer output to write the estimated linear regression equation for predicting Standing Reach from Wingspan.
ŷ =
+
2. Which of the following is the correlation coefficient for the linear relationship between Standing Reach and Wingspan?
OA. 0.7753
В. -0.8805
C. -0.7753
D. 0.8805
3. Each additional 1 inch of Wingspan is associated with a(n) increase
v of
inches in Standing Reach.
4. What is the expected Standing Reach if a player has a Wingspan of 0 inches?
5. The wingspan of Al-Farouq Aminu is 87.25 inches. Calculate the estimated value for the standing reach of Al-Farouq Aminu that is predicted by the
linear model.
Estimated value =
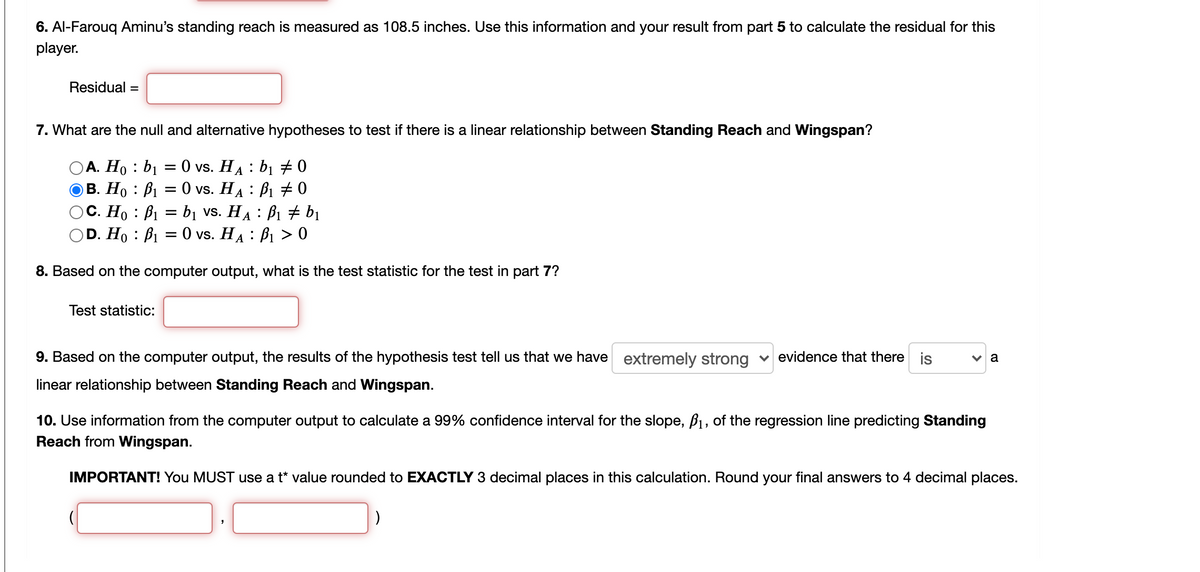
Transcribed Image Text:6. Al-Farouq Aminu's standing reach is measured as 108.5 inches. Use this information and your result from part 5 to calculate the residual for this
player.
Residual =
7. What are the null and alternative hypotheses to test if there is a linear relationship between Standing Reach and Wingspan?
А. Но : bi %3D 0 vs. HA : bi # 0
В. Но : Ві 3 0 vs. HA : Bi +0
OC. Ho : B1 = bị vs. HA : B1 + bị
D. Ho : B1 = 0 vs. HA : B1 > 0
8. Based on the computer output, what is the test statistic for the test in part 7?
Test statistic:
9. Based on the computer output, the results of the hypothesis test tell us that we have extremely strong v evidence that there is
a
linear relationship between Standing Reach and Wingspan.
10. Use information from the computer output to calculate a 99% confidence interval for the slope, B1, of the regression line predicting Standing
Reach from Wingspan.
IMPORTANT! You MUST use a t* value rounded to EXACTLY 3 decimal places in this calculation. Round your final answers to 4 decimal places.
Expert Solution
This question has been solved!
Explore an expertly crafted, step-by-step solution for a thorough understanding of key concepts.

This is a popular solution!

Trending now
This is a popular solution!

Step by step
Solved in 2 steps

Recommended textbooks for you
Algebra & Trigonometry with Analytic Geometry
Algebra
ISBN:
9781133382119
Author:
Swokowski
Publisher:
Cengage
Algebra & Trigonometry with Analytic Geometry
Algebra
ISBN:
9781133382119
Author:
Swokowski
Publisher:
Cengage