Run a regression analysis on the following data set, where y is the final grade in a math class and x is the average number of hours the student spent working on math each week. hours/week Grade y 4 47.6 7 66.8 8 68.2 76.6 11 78.4 13 73.2 13 81.2 15 95 16 93.4 18 90.2 State the regression equation y = m · x + b, with constants accurate to two decimal places. What is the predicted value for the final grade when a student spends an average of 7 hours each week on math? Grade = Round to 1 decimal place.
Run a regression analysis on the following data set, where y is the final grade in a math class and x is the average number of hours the student spent working on math each week. hours/week Grade y 4 47.6 7 66.8 8 68.2 76.6 11 78.4 13 73.2 13 81.2 15 95 16 93.4 18 90.2 State the regression equation y = m · x + b, with constants accurate to two decimal places. What is the predicted value for the final grade when a student spends an average of 7 hours each week on math? Grade = Round to 1 decimal place.

Chapter4: Linear Functions
Section: Chapter Questions
Problem 41RE: For the following exercises, consider the data in Table 5, which shows the percent of unemployed in...

Related questions
Topic Video
Question
Please help
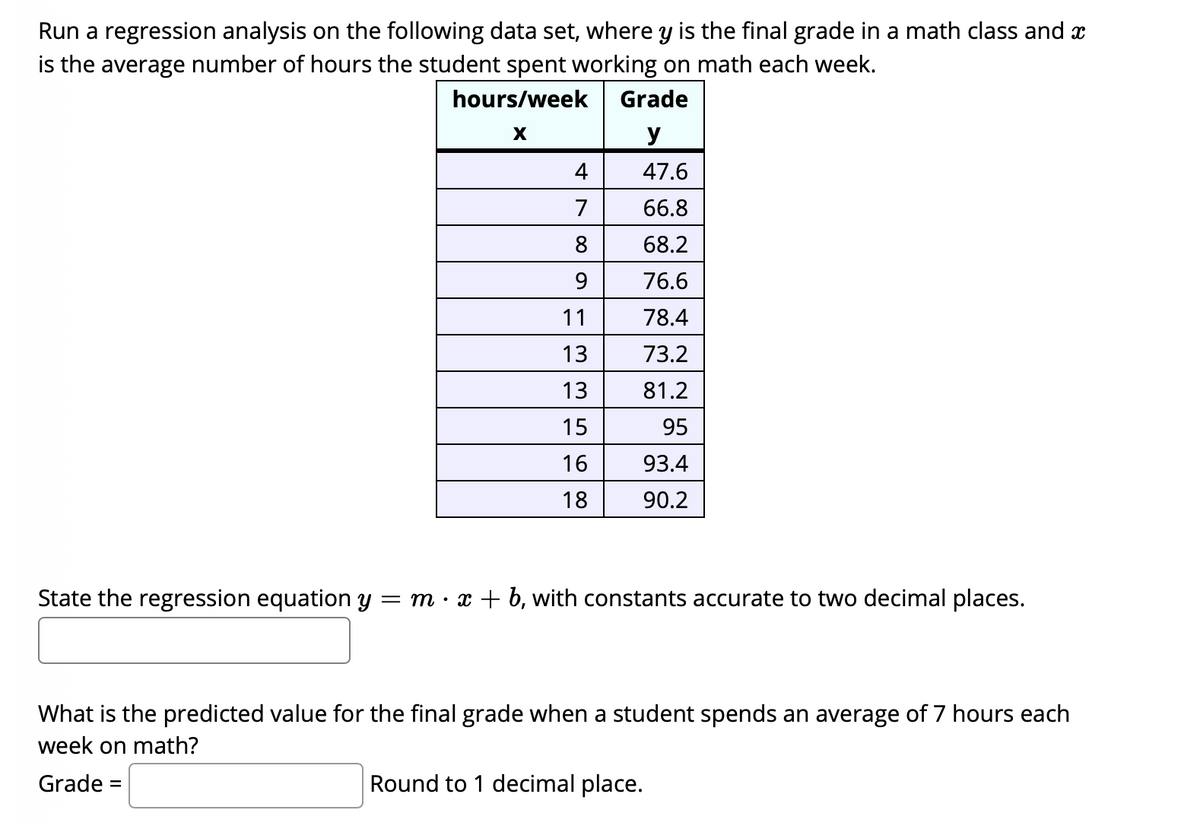
Transcribed Image Text:Run a regression analysis on the following data set, where y is the final grade in a math class and x
is the average number of hours the student spent working on math each week.
hours/week
Grade
y
47.6
7
66.8
8
68.2
9.
76.6
11
78.4
13
73.2
13
81.2
15
95
16
93.4
18
90.2
State the regression equation y
= m · x + b, with constants accurate to two decimal places.
What is the predicted value for the final grade when a student spends an average of 7 hours each
week on math?
Grade =
Round to 1 decimal place.
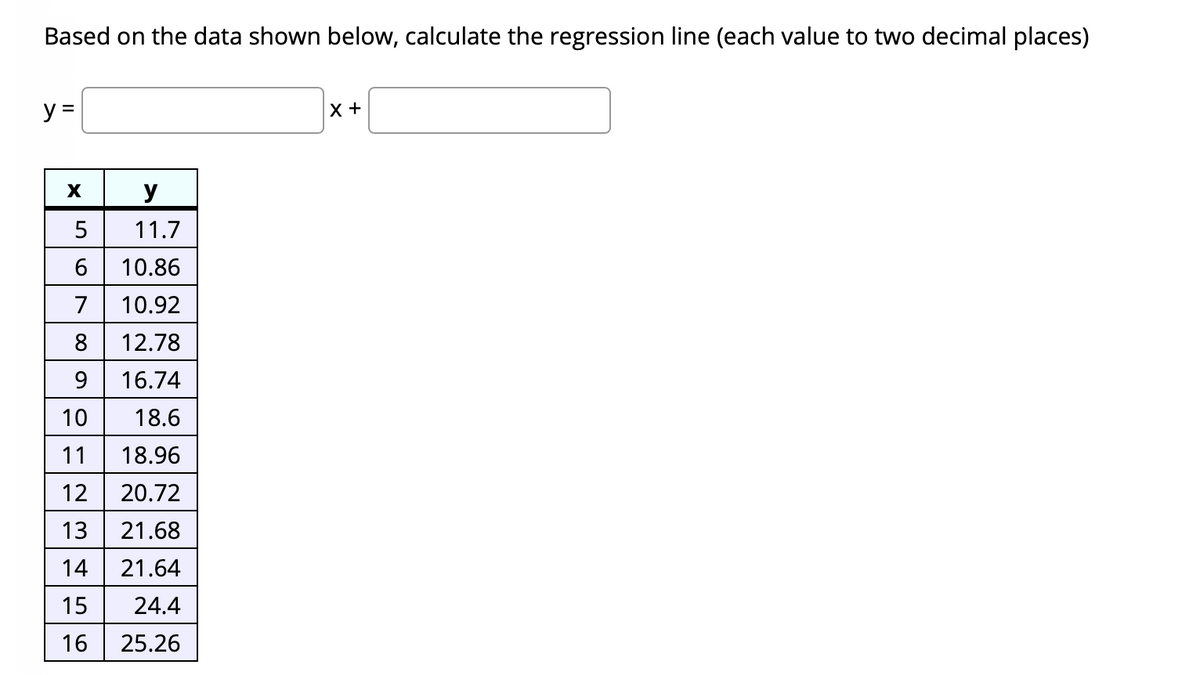
Transcribed Image Text:Based on the data shown below, calculate the regression line (each value to two decimal places)
y =
X +
y
5
11.7
6
10.86
7
10.92
8
12.78
9 16.74
10
18.6
11
18.96
12
20.72
13
21.68
14
21.64
15
24.4
16
25.26
Expert Solution
This question has been solved!
Explore an expertly crafted, step-by-step solution for a thorough understanding of key concepts.

This is a popular solution!

Trending now
This is a popular solution!

Step by step
Solved in 2 steps with 8 images

Knowledge Booster


Learn more about
Need a deep-dive on the concept behind this application? Look no further. Learn more about this topic, statistics and related others by exploring similar questions and additional content below.Recommended textbooks for you

Algebra & Trigonometry with Analytic Geometry
Algebra
ISBN:
9781133382119
Author:
Swokowski
Publisher:
Cengage

Functions and Change: A Modeling Approach to Coll…
Algebra
ISBN:
9781337111348
Author:
Bruce Crauder, Benny Evans, Alan Noell
Publisher:
Cengage Learning
Algebra & Trigonometry with Analytic Geometry
Algebra
ISBN:
9781133382119
Author:
Swokowski
Publisher:
Cengage
Functions and Change: A Modeling Approach to Coll…
Algebra
ISBN:
9781337111348
Author:
Bruce Crauder, Benny Evans, Alan Noell
Publisher:
Cengage Learning