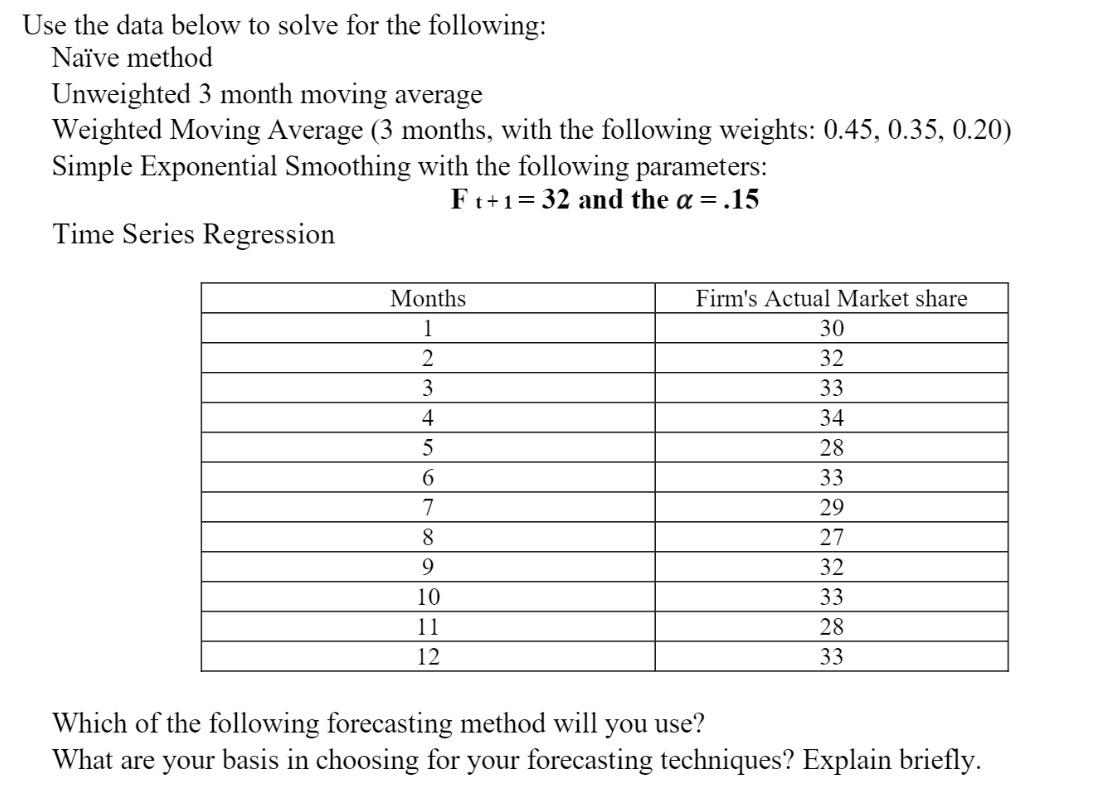
Use the data below to solve for the following: Naïve method Unweighted 3 month moving average Weighted Moving Average (3 months, with the following weights: 0.45, 0.35, 0.20) Simple Exponential Smoothing with the following parameters: Ft+1=32 and the α = .15 Time Series Regression Months 1 2 3 4 5 6 7 8 9 10 11 12 Firm's Actual Market share 30 32 33 34 28 33 29 27 32 33 28 33 Which of the following forecasting method will you use? What are your basis in choosing for your forecasting techniques? Explain briefly.


Q: Given the following information for a one-year project, answer the following questions. Recall that…
A: *As per the guideline, the first three parts are answerable in multipart questions, please repost…
Q: Discuss a situation where constrained optimization is used?
A: Constrained optimization has long been recognized as a potent method for addressing a wide range of…
Q: In project management, a number of tools are required to ensure effective cost management. You are…
A: Expert judgment is a widely used method in project planning. As the name suggests it is a judgment…
Q: What are the functions of Quality Assurance and Quality Control in pharmaceutical industries?…
A: Every area that might have an influence on the quality of prescribed pharmaceutical items is…
Q: Assume the maximum demand for Super is 600,000 barrels. What is the optimal maximum profit?…
A: Given data is Fuel type Revenue Max Demand Regular $18.50 350,000 Super $20 600,000…
Q: Use the technique developed in this section to solve the minimization problem. Minimize C = 10x + y…
A: Objective Functions: Minimize C= 10 x+ y Constraints: Subject to- 4x+y≥24 (Constraint 1)…
Q: A schedule for two processors has been created for the following project which has a finishing time…
A: A network diagram along with activity timings is given:
Q: Leach Distributors packages and distributes industrial supplies. A standard shipment can be packaged…
A: The detailed solution is given in Steps ahead.
Q: Which one of the following statements is more of a general characteristic of a service organization,…
A: Operation management often called OM can be stated as the administration or legislation of business…
Q: A firm is considering two location alternatives. At location C, fixed costs would be $5,000,000 per…
A: Given data is Location Fixed cost Variable cost C $5,000,000 $0.25 D $4,500,000 $0.35…
Q: The officers should rent buses and vans to minimize the transportation costs.
A: Linear programming is a mathematical technique that is also used in operations management…
Q: Explain why businesses should internalise production within the firm and what are the transaction…
A: Business is unpredictable and dynamic in nature. All processes and systems that are happening inside…
Q: Could you quickly explain any two of the outputs that arise from the process of controlling quality…
A: The quality control process is a widely used process method in projects. Its aim is to measure the…
Q: Could you quickly explain any two of the outputs that arise from the process of controlling quality…
A: The quality control process is a widely used method in many projects. It is because every firm needs…
Q: ITEM CATEGORY Paper Products Dishes, Glasses, and Silverware Cleaning Agent Cooking Oils and…
A:
Q: fter reviewing the solution to part (c), the bank manager realized that some additional requirements…
A: Objective Functions and Constraints: Based on the given details, the objective…
Q: a) The reorder point = enter your response here breads (round your response to the nearest whole…
A: Inventory management is the management in which company stores and holds the raw materials as well…
Q: Are there any common errors you've seen in Performance Testing?
A: Performance testing, as the name suggests is a method to test the performance of systems in terms of…
Q: 1. a.) What is forecasting? b. Explain the importance of forecasting for managers like you? c.) What…
A: 1a) Forecasting is a methodology that employs previous or historical data as primary inputs so as to…
Q: How can we weigh the pros and cons of redesigning the keyboards
A: Pros of redesigning a keyboard: 1) Neck problem, continuous pain in hands and forearms due to…
Q: Describe the role of monitoring and controlling as a life cycle phase on a project you have been…
A: Project life cycle:- The processes needed for project managers to successfully oversee a project…
Q: Please explain two characteristics of the maximum of minimum profits criterion (Maximin method)
A: Decision-making is influenced by an organization as per the degree of certainty involved in this. In…
Q: Question 3 Use a weighted score model to choose between three methods (A, B, C,D) of financing the…
A: The weighted Score Model is a method used in business where different types of decisions and…
Q: You want to determine the control lines for a "p" chart for quality control purposes. If the total…
A: Answer = 0.04841
Q: ts utilized to define IT project
A: Projects involving computer systems, databases, and related infrastructure are all considered IT…
Q: Using the four (4) main costs of quality, re-arrange the following costs of Allison’s Company in the…
A: 1. Prevention Costs – costs from preventive actions to minimize the defects 2. Appraisal…
Q: Using Johnson's rule for 2-machine scheduling, the sequence is: Scheduled Order Job 1 <BUDE" 2 A 3 4…
A: Given data: Job Operation - 1 Operation - 2 A 12 4 B 8 11 C 5 14 D 6 2 E 9 10 F 3 1…
Q: Exercise: Come up with a Matrix and compare the Average Flowtime and Average Tardiness Using FCFS,…
A: Sequencing is an appropriate order of plan as per which the process of operations works. It defines…
Q: What is the average inventory? What is the average flow time? What is the required safety…
A: NOTE: We are allowed to do the first three sub-parts only.
Q: Machinists who work at a tool-and-die plant must check out tools from a tool center. An average of…
A:
Q: integration process except for
A: Given Below are the considerations while a particular integration process takes place:
Q: Suppose you want to invest a maximum amount of $20,000 in a portfolio with the objective to maximize…
A: note: only formulation has been asked.
Q: What are the most important goals in operations and supply chain management?
A: Operations management is described as a means or a process of managing the operations of an…
Q: Problem 13-8 (Algo) A shirt manufacturer buys cloth by the 100-yard roll from a supplier. For…
A: From the given information, Average irregularities, c bar =Total irregularities ÷sample size…
Q: 3c. Customers arrive at a Starbucks that has 1 barista and they wait in line on a first-come, first-…
A: Given, Arrival rate,λ =12 per hour Service rate, μ=3.5×60 =17.14 customers per hour Standard…
Q: All work packages under the scope of work are displayed: Select one: a. In the Work Breakdown…
A: Note- Hi! Thank you for the question As per the honour code, We’ll answer the first question since…
Q: A project plan is a company's information security blueprint, but how does this occur?
A: A security blueprint is a rough draft that forms part of a company's important document. It contains…
Q: a) what would be an appropriate reorder paint? b) How does your ur answer
A:
Q: Give example of FDI that invest in internalise production within the firm that vertically integrate…
A: FDI also known as Foreign Direct Investment is the concept that has greatly changed the way business…
Q: A project consists of five activities listed below. The project network is shown for the activities.…
A: Formulae used: Expected time of an activity= ( O + 4.M + P )6 Where, O=OptimisticM= Most…
Q: 3. Daily demand for tablets of amazon is normally distributed, with a mean of 100 and standard…
A: Here, the firm is following a periodic review policy, the review period is 30 days, considering the…
Q: constraints. Q3. Solve the following LP problem by using The Simplex Algorithm. (Keep loyal to the…
A: Given LP- MAX Z = 3X1 + 5X2 + 6X3subject to -2X1 + X2 + X3≤4X1 + 2X2 + X3≤4X1 + X2 + 2X3≤4X1 + X2 +…
Q: kitchen layout under consideration for its recipe making and testing department. The strategy is to…
A: Ans) Cumulative load distance or movement cost = Sum ( product of distance and number of trips for…
Q: What type of business structure does an online store have?
A: Business structure can be stated as the legal structure of a company that is registered under…
Q: The owner of a large machine ship has just finished its financial analysis from the prior fiscal…
A: Net Revenue(N) = $500,000 Cost of goods sold(COGS) = $328,250 Value of product material on hand(M)=…
Q: The following table lists the components needed to assemble an end item, lead times (in weeks), and…
A: A time based production chart and Product structure chart are helps to identify the correct…
Q: "Nordlund Boat Company has been repairing, refitting, and building custom boats for over 60 years in…
A: Order release = Every 4 weeks Annual demand = 400 units (2 units per day) Working days = Annual…
Q: Rick Jerz is attempting to perform an inventory analysis on one of his most popular products. Annual…
A: From the above given information, Annual demand, d =5000 units Ordering cost, o =$30 Holding cost, h…
Q: eric strategies that are enabled by information technology to effectively deal with the competitive…
A: Gaining Competitive Advantage via the Use of Information SystemsTo gain an advantage over the…
Q: If the forecasted value of the time series variable for one period is 28.5 and the actual value…
A: Forecasted value = 28.5 Actual value = 32
PLEASE DO THIS BY EXCEL AND COMPLETE SOLUTION AND FORMULAS. I WILL UPVOTE THANK YOU

Step by step
Solved in 5 steps with 9 images

- A small computer chip manufacturer wants to forecast monthly ozperating costs as a function of the number of units produced during a month. The company has collected the 16 months of data in the file P13_34.xlsx. a. Determine an equation that can be used to predict monthly production costs from units produced. Are there any outliers? b. How could the regression line obtained in part a be used to determine whether the company was efficient or inefficient during any particular month?Suppose that a regional express delivery service company wants to estimate the cost of shipping a package (Y) as a function of cargo type, where cargo type includes the following possibilities: fragile, semifragile, and durable. Costs for 15 randomly chosen packages of approximately the same weight and same distance shipped, but of different cargo types, are provided in the file P13_16.xlsx. a. Estimate a regression equation using the given sample data, and interpret the estimated regression coefficients. b. According to the estimated regression equation, which cargo type is the most costly to ship? Which cargo type is the least costly to ship? c. How well does the estimated equation fit the given sample data? How might the fit be improved? d. Given the estimated regression equation, predict the cost of shipping a package with semifragile cargo.The management of a technology company is trying to determine the variable that best explains the variation of employee salaries using a sample of 52 full-time employees; see the file P13_08.xlsx. Estimate simple linear regression equations to identify which of the following has the strongest linear relationship with annual salary: the employees gender, age, number of years of relevant work experience prior to employment at the company, number of years of employment at the company, or number of years of post secondary education. Provide support for your conclusion.
- The owner of a restaurant in Bloomington, Indiana, has recorded sales data for the past 19 years. He has also recorded data on potentially relevant variables. The data are listed in the file P13_17.xlsx. a. Estimate a simple regression equation involving annual sales (the dependent variable) and the size of the population residing within 10 miles of the restaurant (the explanatory variable). Interpret R-square for this regression. b. Add another explanatory variableannual advertising expendituresto the regression equation in part a. Estimate and interpret this expanded equation. How does the R-square value for this multiple regression equation compare to that of the simple regression equation estimated in part a? Explain any difference between the two R-square values. How can you use the adjusted R-squares for a comparison of the two equations? c. Add one more explanatory variable to the multiple regression equation estimated in part b. In particular, estimate and interpret the coefficients of a multiple regression equation that includes the previous years advertising expenditure. How does the inclusion of this third explanatory variable affect the R-square, compared to the corresponding values for the equation of part b? Explain any changes in this value. What does the adjusted R-square for the new equation tell you?Stock market analysts are continually looking for reliable predictors of stock prices. Consider the problem of modeling the price per share of electric utility stocks (Y). Two variables thought to influence this stock price are return on average equity (X1) and annual dividend rate (X2). The stock price, returns on equity, and dividend rates on a randomly selected day for 16 electric utility stocks are provided in the file P13_15.xlsx. Estimate a multiple regression equation using the given data. Interpret each of the estimated regression coefficients. Also, interpret the standard error of estimate and the R-square value for these data.Do the sales prices of houses in a given community vary systematically with their sizes (as measured in square feet)? Answer this question by estimating a simple regression equation where the sales price of the house is the dependent variable, and the size of the house is the explanatory variable. Use the sample data given in P13_06.xlsx. Interpret your estimated equation, the associated R-square value, and the associated standard error of estimate.
- A trucking company wants to predict the yearly maintenance expense (Y) for a truck using the number of miles driven during the year (X1) and the age of the truck (X2, in years) at the beginning of the year. The company has gathered the data given in the file P13_13.xlsx. Note that each observation corresponds to a particular truck. Estimate a multiple regression equation using the given data. Interpret each of the estimated regression coefficients. Also, interpret the standard error of estimate and the R-square value for these data.Management of a home appliance store would like to understand the growth pattern of the monthly sales of Blu-ray disc players over the past two years. Managers have recorded the relevant data in the file P13_33.xlsx. a. Create a scatterplot for these data. Comment on the observed behavior of monthly sales at this store over time. b. Estimate an appropriate regression equation to explain the variation of monthly sales over the given time period. Interpret the estimated regression coefficients. c. Analyze the estimated equations residuals. Do they suggest that the regression equation is adequate? If not, return to part b and revise your equation. Continue to revise the equation until the results are satisfactory.An antique collector believes that the price received for a particular item increases with its age and with the number of bidders. The file P13_14.xlsx contains data on these three variables for 32 recently auctioned comparable items. Estimate a multiple regression equation using the given data. Interpret each of the estimated regression coefficients. Is the antique collector correct in believing that the price received for the item increases with its age and with the number of bidders? Interpret the standard error of estimate and the R-square value for these data.
- The file P13_26.xlsx contains the monthly number of airline tickets sold by the CareFree Travel Agency. a. Create a time series chart of the data. Based on what you see, which of the exponential smoothing models do you think will provide the best forecasting model? Why? b. Use simple exponential smoothing to forecast these data, using a smoothing constant of 0.1. c. Repeat part b, but search for the smoothing constant that makes RMSE as small as possible. Does it make much of an improvement over the model in part b?The file P13_02.xlsx contains five years of monthly data on sales (number of units sold) for a particular company. The company suspects that except for random noise, its sales are growing by a constant percentage each month and will continue to do so for at least the near future. a. Explain briefly whether the plot of the series visually supports the companys suspicion. b. By what percentage are sales increasing each month? c. What is the MAPE for the forecast model in part b? In words, what does it measure? Considering its magnitude, does the model seem to be doing a good job? d. In words, how does the model make forecasts for future months? Specifically, given the forecast value for the last month in the data set, what simple arithmetic could you use to obtain forecasts for the next few months?The file P13_29.xlsx contains monthly time series data for total U.S. retail sales of building materials (which includes retail sales of building materials, hardware and garden supply stores, and mobile home dealers). a. Is seasonality present in these data? If so, characterize the seasonality pattern. b. Use Winters method to forecast this series with smoothing constants = = 0.1 and = 0.3. Does the forecast series seem to track the seasonal pattern well? What are your forecasts for the next 12 months?