Use the data in the table to the right to answer the following questions. Weights (g) of a Sample Bag of Candy Green 0.729 0.764 0.833 0.835 Red Blue Brown Yellow 0.809 0.972 0.994 0.835 0.969 0.871 0.982 0.747 0.815 0.874 0.749 0.806 0.834 0.822 Find the sample proportion of candy that are red. 0.816 0.721 0.778 The proportion of red candy = 25 (Type an integer or decimal rounded to three decimal places as needed. ) 0.798 0.849 0.751 0.994 0.831 0.713 0.918 0.751 0.813 0.778 0.883 0.804 0.996 0.829 0.728 0.799 Use that result to construct a 95% confidence interval estimate of the population 0.938 percentage of candy that are red. 0.735 0.926 %
Use the data in the table to the right to answer the following questions. Weights (g) of a Sample Bag of Candy Green 0.729 0.764 0.833 0.835 Red Blue Brown Yellow 0.809 0.972 0.994 0.835 0.969 0.871 0.982 0.747 0.815 0.874 0.749 0.806 0.834 0.822 Find the sample proportion of candy that are red. 0.816 0.721 0.778 The proportion of red candy = 25 (Type an integer or decimal rounded to three decimal places as needed. ) 0.798 0.849 0.751 0.994 0.831 0.713 0.918 0.751 0.813 0.778 0.883 0.804 0.996 0.829 0.728 0.799 Use that result to construct a 95% confidence interval estimate of the population 0.938 percentage of candy that are red. 0.735 0.926 %

Glencoe Algebra 1, Student Edition, 9780079039897, 0079039898, 2018
18th Edition
ISBN:9780079039897
Author:Carter
Publisher:Carter
Chapter10: Statistics
Section10.4: Distributions Of Data
Problem 19PFA

Related questions
Question
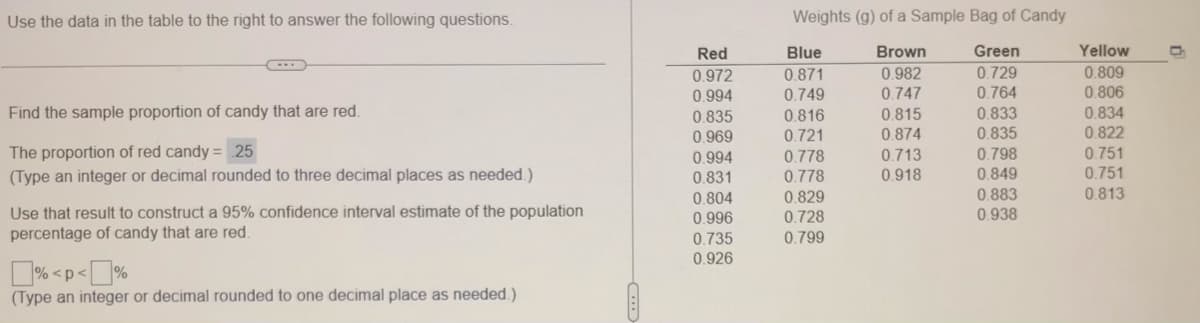
Transcribed Image Text:Use the data in the table to the right to answer the following questions.
Weights (g) of a Sample Bag of Candy
Red
Blue
Brown
Green
Yellow
0.982
0.747
0.871
0.729
0.809
0.972
0.994
0.749
0.764
0.806
Find the sample proportion of candy that are red.
0.833
0.834
0.835
0.969
0.815
0.874
0.816
0.835
0.798
0.849
0.721
0.822
The proportion of red candy = 25
(Type an integer or decimal rounded to three decimal places as needed.)
0.751
0.713
0.918
0.994
0.778
0.831
0.778
0.751
0.804
0.829
0.883
0.813
Use that result to construct a 95% confidence interval estimate of the population
0.996
0.728
0.938
percentage of candy that are red.
0.735
0.926
0.799
% <p<D%
(Type an integer or decimal rounded to one decimal place as needed.)
Expert Solution
This question has been solved!
Explore an expertly crafted, step-by-step solution for a thorough understanding of key concepts.

This is a popular solution!

Trending now
This is a popular solution!

Step by step
Solved in 2 steps with 4 images

Recommended textbooks for you
Glencoe Algebra 1, Student Edition, 9780079039897…
Algebra
ISBN:
9780079039897
Author:
Carter
Publisher:
McGraw Hill

Big Ideas Math A Bridge To Success Algebra 1: Stu…
Algebra
ISBN:
9781680331141
Author:
HOUGHTON MIFFLIN HARCOURT
Publisher:
Houghton Mifflin Harcourt
Glencoe Algebra 1, Student Edition, 9780079039897…
Algebra
ISBN:
9780079039897
Author:
Carter
Publisher:
McGraw Hill
Big Ideas Math A Bridge To Success Algebra 1: Stu…
Algebra
ISBN:
9781680331141
Author:
HOUGHTON MIFFLIN HARCOURT
Publisher:
Houghton Mifflin Harcourt