Use the data 'kielmc' and draw an histogram of log house prices. Log House price 10.0 10.5 11.0 115 12.0 12.5 Logarthm (House seling price) Do you obtain this graph which looks more normally distributed? 09 Aouanbaid
Use the data 'kielmc' and draw an histogram of log house prices. Log House price 10.0 10.5 11.0 115 12.0 12.5 Logarthm (House seling price) Do you obtain this graph which looks more normally distributed? 09 Aouanbaid

Glencoe Algebra 1, Student Edition, 9780079039897, 0079039898, 2018
18th Edition
ISBN:9780079039897
Author:Carter
Publisher:Carter
Chapter10: Statistics
Section10.6: Summarizing Categorical Data
Problem 23PPS

Related questions
Question
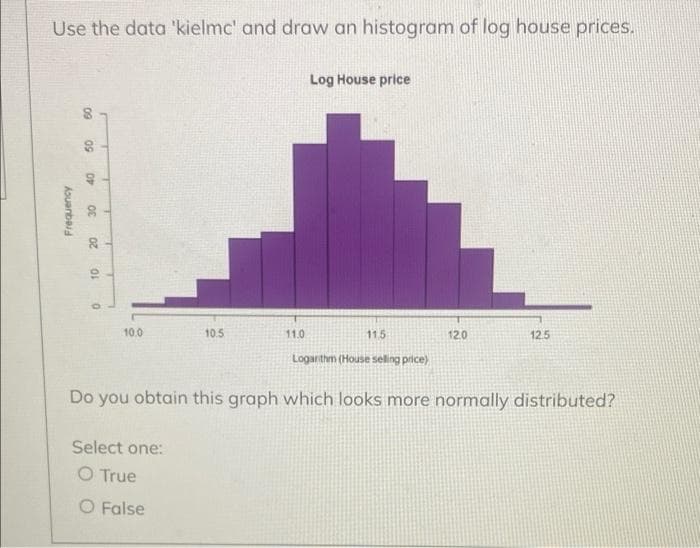
Transcribed Image Text:Use the data 'kielmc' and draw an histogram of log house prices.
Log House price
10.0
10.5
11.0
11.5
12.0
12.5
Logarthm (House seling price)
Do you obtain this graph which looks more normally distributed?
Select one:
O True
O False
09
09
Asuanbai
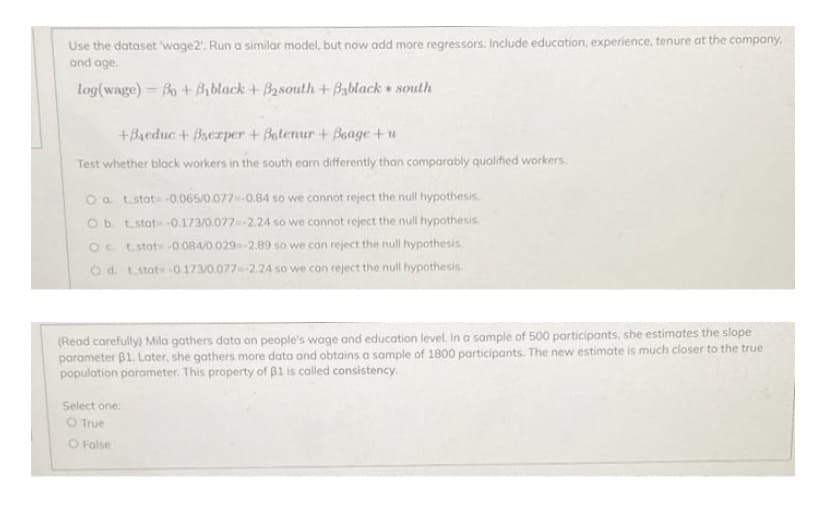
Transcribed Image Text:Use the dataset 'wage2". Run a similar model, but now add more regressors. Include education, experience, tenure at the company.
and age.
log(wage) = Bo+ B,black + Basouth+Bablack+ south
+Baeduc + Bserper + Batenur + Beage +u
Test whether black workers in the south earn differently than comparably qualified workers.
Oa tstot-0.065/0.077--0.84 so we connot reject the null hypothesis.
Ob tstot -0.173/0.077 -2.24 so we connot reject the null hypothesis.
Oc Lstot -0.084/0.029-2.89 so we can reject the null hypothesis
Od. Lstot 0173/0.077-2.24 so we can reject the null hypothesis
(Read carefully) Mila gathers data on people's wage and education level. in a sample of 500 participants, she estimates the slope
parameter B1. Later, she gathers more data and obtains a sample of 1800 participants. The new estimate is much closer to the true
population parameter. This property of B1 is colled consistency.
Select one:
O True
O Folse
Expert Solution
This question has been solved!
Explore an expertly crafted, step-by-step solution for a thorough understanding of key concepts.

Step by step
Solved in 2 steps

Recommended textbooks for you
Glencoe Algebra 1, Student Edition, 9780079039897…
Algebra
ISBN:
9780079039897
Author:
Carter
Publisher:
McGraw Hill

Big Ideas Math A Bridge To Success Algebra 1: Stu…
Algebra
ISBN:
9781680331141
Author:
HOUGHTON MIFFLIN HARCOURT
Publisher:
Houghton Mifflin Harcourt

Holt Mcdougal Larson Pre-algebra: Student Edition…
Algebra
ISBN:
9780547587776
Author:
HOLT MCDOUGAL
Publisher:
HOLT MCDOUGAL
Glencoe Algebra 1, Student Edition, 9780079039897…
Algebra
ISBN:
9780079039897
Author:
Carter
Publisher:
McGraw Hill
Big Ideas Math A Bridge To Success Algebra 1: Stu…
Algebra
ISBN:
9781680331141
Author:
HOUGHTON MIFFLIN HARCOURT
Publisher:
Houghton Mifflin Harcourt
Holt Mcdougal Larson Pre-algebra: Student Edition…
Algebra
ISBN:
9780547587776
Author:
HOLT MCDOUGAL
Publisher:
HOLT MCDOUGAL