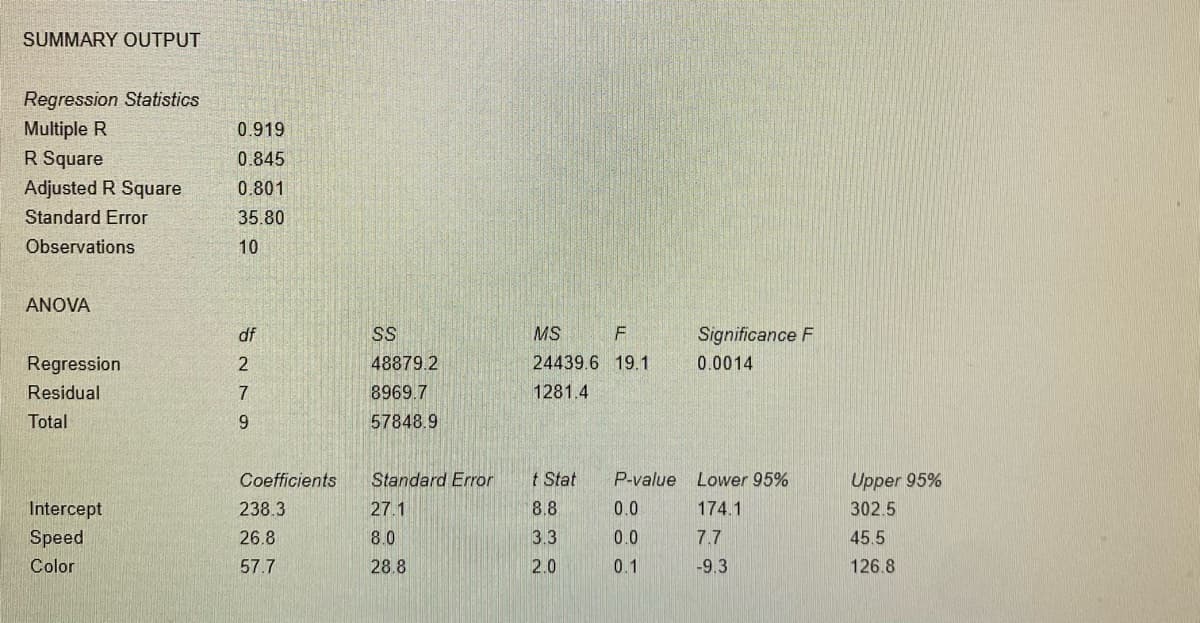
Based on the regression output, if a printer can print 4.8 pages per minute and copies in color, what is the predicted price?


Q: 3. The following table gives home values of 10 homes in three neighborhoods: Neighborhood A $800,000...
A: Given information: Consider the table that gives the home values of 10 homes. Neighborhood A Neig...
Q: The patient recovery time from a particular surgical procedure is normally distributed with a mean o...
A:
Q: 13. An independent-measures research study uses two samples; each group has n = 12 participants. If ...
A: Given that :- An independent-measures research study uses two samples; each group has n = 12 partici...
Q: Terri Vogel, an amateur motorcycle racer, averages 129.71 seconds per 2.5 mile lap (in a seven-lap r...
A: Given that Mean=129.71 Standard deviation=2.28 Note: According to bartleby experts question answers...
Q: Belsky, Weinrub, Owen and Kelly (2001) reported on the effects of preschool child care on the develo...
A: It is given that Sample size n = 16 Sample mean = 42.7 Sample SD = 6 Level of significance = 0.01
Q: A poultry raiser harvests an average of 300 eggs per day. He has recently experimented with the diff...
A: It is given that Sample size n = 20 Sample mean M = 290 Sample SD s = 15 Level of significance = 0.0...
Q: What is the expected number of “4” obtained? What is the standard deviation of the number of “2” obt...
A:
Q: 2. Verify that the requirements for constructing a confidence interval for the proportion are satisf...
A: To construct the confidence interval for the proportion the following conditions would be met. 1. Sa...
Q: Consider the following time series. Quarter Year 1 Year 2 Year 3 1 70 67 61 2 48 40 50 58 60 53 4 77...
A: Given data: Quarter Year 1 Year 2 Year 3 1 70 67 61 2 48 40 50 3 58 60 53 4 77 80 71
Q: 2. A Type Il error is committed when A. we reject a null hypothesis that is true. B. we retain a nul...
A: The type II error is the probability of fail to reject the null hypothesis when alternative hypothes...
Q: In a sample of 61 business trips taken by employees in the HR department, a company finds that the a...
A: Let µ1 denote the average amount spent on trips taken by the HR department and µ2 denote the average...
Q: Find the probability that the time it takes a passenger to travel from the main terminal to the conc...
A: Passenger congestion is a service problem in airports. Trains are installed within the airport to re...
Q: Premature-birth Risk Found Higher for Teens (reported in the Sacramento Bee, April 27, 1995, p. A7) ...
A: Given Relative risk=1.9 Find Absolute risk for women in their 20's which is used as baseline
Q: A. Read Quarter 3_Module 8 involving finding the probability of AUB on pages 3-8. Answer the problem...
A: Sample space=S={1,2,3,4,5,6,7,8} X={1,2,3,5} Y={2,4,6,8} Note: According to Bartleby guidelines expe...
Q: Determine the following: 1. Class size 2. Number of classes 3. Classmark of the third class
A:
Q: Choose the correct answer below. A. A 95% confidence interval must be wider than an 80% confidence i...
A: We have given that the data from a poll of 2000 adults who were asked to identify their favourite pi...
Q: b. Let U and W be mutually exclusive events where P(U) = 0.32 and P(W) = 0.45. Find each of the foll...
A: here use venn diagram and probability rule
Q: A social psychologist recently developed a childhood-memories test that is intended to measure how p...
A: Hypothesis, H0: The mean score is u= 60 H1: The mean score is not 60. u=! 60 Given that, Mean, x̄= ...
Q: Determine whether each situation/question would best be determined by an experiment or a survey/stud...
A: Experiment study : Researchers conduct experimental studies when they provide an intervention and ob...
Q: Find the critical valued for the given confidence level c and sample size n. c=0.98, n= 23 2 = (Roun...
A:
Q: In a clinical trial, 3% of the patients in the study experienced fatigue as a side effect. Suppose t...
A: Given that n=20 , p=3%=0.03 , q=1-p=1-0.03=0.97 X~Binomial(n=20 , p=0.03) X=Number of the patients ...
Q: 12% of all Americans suffer from sleep apnea. A researcher suspects that a higher percentage of thos...
A:
Q: Suppose that a biased coin is tossed 50 times. In each flip, the probability of getting head is 3/8 ...
A: Given that, a biased coin is tossed 50 times. In each flip, the probability of getting head is 3/8 W...
Q: How many females are in your sample? How many males? What proportion of your sample is female? What ...
A: Note: Hi, thank you for the question. As per our company guideline we are supposed to answer only fi...
Q: he following results are from data where the dependent variable is the selling price of used cars, t...
A: Given:
Q: Suppose that people's heights (in centimeters) are normally distributed, with a mean of 170 and a st...
A: First we find the probabilities needed to obtaining the answers for given questions, (a) (b) ...
Q: Kim wants to determine a 80 percent confidence interval for the true proportion of high school stude...
A: Given: Margin of error, E=0.04 Confidence level=80%
Q: 11. At a stop sign, some drivers come to a full stop, some come to a 'rolling stop' (not a full stop...
A: two variables are given gender and type of stop To test the association between gender and type of s...
Q: 1. A simple random sample of 30 applicants will provide an estimate of the population mean SAT score...
A: Given,sample size(n)=30mean(μ)=990standard deviation(σ)=80
Q: Find the rejection region for each hypothesis test based on the information given (make a graph and ...
A: GivenH0:μ=121Ha:μ>121α=0.01n=39standard deviation(σ) is known
Q: What did you do to identify the area of the shaded region?
A: For normal distribution we use normal table to find the area of the region.
Q: For #2 - #6: A random sample of individuals (n=10) is selected from a population with µ = 4. A treat...
A: A single sample t test is used to test the claim about the population mean. It is used when the samp...
Q: It known that the average number of drop out per month 2.3. If you would like to predict the number ...
A:
Q: You measure 26 randomly selected textbooks' weights, and find they have a mean weight of 69 ounces. ...
A: Given that x̄ = 69 , ? = 13.4 , n =26
Q: A published report claims that 35% of college students have used an online dating site or app. Beli...
A:
Q: A parameter is a numerical attribute of a while a statistic is a numerical attribute of a sample; po...
A: Followings are the Explanation of the question Option :- Population , Sample 1) Population :- It ...
Q: The systolic blood pressure (given in millimeters) of males has an approximately normal distribution...
A: We have given that Mean(µ) = 135Standard deviations (σ) = 18
Q: A professional skier was trying to decide whether to use a new racing wax for cross-country skis. He...
A: Given: the wax by racing on the course 8 times, n=8 Sample of race times found a mean of 53.1 secon...
Q: Scores of an IQ test have a bell-shaped distribution with a mean of 100 and a standard deviation of ...
A:
Q: An energy company wants to choose between two regions in a state to install energy-producing wind tu...
A:
Q: 4. Mr. Zamora, an admission officer in a university would like to estimate how long will it take to ...
A:
Q: Determine the area more than z=-1.03 0.8486 O 0.8485 O 0.1515 O 0.1516 Determine the area below z=-0...
A: The objective is to define the area (in terms of proportion) below or above the given z-scores.
Q: B. Read Quarter 3_Module 9 involving Illustrating mutually exclusive and not mutually exclusive even...
A: Two events are said to be mutually exclusive if they have no elements in common.
Q: A sample of n=25 individuals is randomly selected from a population with a mean of u=65, and a treat...
A: For the given data perform t test for one mean
Q: People tend to evaluate the quality of their lives to others around them. In a demonstration of this...
A: Given that, the scores are measures of a life-satisfaction scale for a sample of n=9 elderly people ...
Q: According the 2001 CSO mortality table, the yearly probability of dying for a 40 year-old man is L00...
A: The commissioners standard ordinary mortality table is an actuarial table used to compute the minimu...
Q: Given the following the population data: 32 36 40 36 32 1. How many random samples of size 3 can be ...
A: Given the following population data: 32, 36, 40, 36, 32 We need to find:- 1. Number of random sample...
Q: Commuting to work: A community survey sampled 1923 people in Colorado and asked them how long it too...
A: Note: According to Bartleby guidelines expert solve only one question and rest can be reposted.
Q: 14. A researcher obtains a t = 2.25 for a repeated-measures study using a sample of n = 15 participa...
A: It is given that Test statistic t = 2.25 Sample size n = 15
Q: 14) Prior to a set of compensation policy changes at a company 30% of the employees surveyed said th...
A: Given The survey report out of 191 employees,59 liked their job 107 moderately liked their job and r...

Step by step
Solved in 2 steps

- A pharmaceutical company fills a drug which is in a powder form into a bottle. It has an automatedprocess consisting of a filling machine and a sealing unit. After filling the bottle, it is automaticallysealed with a metallic cap. To monitor the quality of the process, samples of size 5 are drawnperiodically from the process and the quantity filled is measured. The table below has data on 12such observations.Sample 1 2 3 4 51 9.21 8.87 8.71 9.08 9.342 9.06 8.97 9.13 8.46 8.853 9.35 8.95 9.20 9.03 8.444 9.21 8.71 9.05 9.35 8.875 9.01 9.17 9.21 9.05 9.536 8.74 8.35 8.50 9.06 8.897 9.21 9.05 9.00 8.78 9.238 9.15 9.20 9.23 9.15 9.069 8.98 8.81 8.90 9.13 9.0510 9.03 9.10 9.26 9.44 8.4811 9.49 9.05 9.12 8.88 8.9312 8.95 9.10 9.02 9.04 8.96(a) Establish the upper and lower control limits for the X bar chart and the R Chart(b) Construct a control chart and investigate if the process is in controlValues for setting the control charts are A2 = 0.577, D3 = 0, D4 = 2.114Chest Deceleration Measurements (g) from a Standard Crash Test Small 44 39 37 54 39 44 42 Midsize 36 53 43 42 52 49 41 Large 32 45 41 38 37 38 33 SPSS Results Sum of Squares df Mean Square F Sig. Between Groups 200.857 2 100.429 3.288 0.061 Within Groups 549.714 18 30.540 Total 750.571 20Aspen Plastics produces plastic bottles to customer order. The quality inspector randomly selects four bottles from the bottle machine and measures the outside diameter of the bottleneck, a critical quality dimension that determines whether the bottle cap will fit properly. The dimensions (inch) from the last six samples are: BOTTLE Sample 1 2 3 4 1 0.694 0.622 0.698 0.69 2 0.687 0.611 0.697 0.613 3 0.671 0.680 0.695 0.602 4 0.610 0.615 0.685 0.678 5 0.680 0.624 0.618 0.614 6 0.685 0.693 0.607 0.669 What would be the upper control limit of a 3-sigma R chart? Answer:
- Aspen Plastics produces plastic bottles to customer order. The quality inspector randomly selects four bottles from the bottle machine and measures the outside diameter of the bottleneck, a critical quality dimension that determines whether the bottle cap will fit properly. The dimensions (inch) from the last six samples are: BOTTLE Sample 1 2 3 4 1 0.694 0.622 0.698 0.69 2 0.687 0.611 0.697 0.613 3 0.671 0.680 0.695 0.602 4 0.610 0.615 0.685 0.678 5 0.680 0.624 0.618 0.614 6 0.685 0.693 0.607 0.669 What would be the lower control limits of a 3-sigma ?¯x¯ chart? Answer:Aspen Plastics produces plastic bottles to customer order. The quality inspector randomly selects four bottles from the bottle machine and measures the outside diameter of the bottleneck, a critical quality dimension that determines whether the bottle cap will fit properly. The dimensions (inch) from the last six samples are: BOTTLE Sample 1 2 3 4 1 0.694 0.622 0.698 0.69 2 0.687 0.611 0.697 0.613 3 0.671 0.680 0.695 0.602 4 0.610 0.615 0.685 0.678 5 0.680 0.624 0.618 0.614 6 0.685 0.693 0.607 0.669 What would be the lower control limits of a 3-sigma ?¯x¯ chart? ( x bar chart )Aspen Plastics produces plastic bottles to customer order. The quality inspector randomly selects four bottles from the bottle machine and measures the outside diameter of the bottleneck, a critical quality dimension that determines whether the bottle cap will fit properly. The dimensions (inch) from the last six samples are: BOTTLE Sample 1 2 3 4 1 0.694 0.622 0.698 0.69 2 0.687 0.611 0.697 0.613 3 0.671 0.680 0.695 0.602 4 0.610 0.615 0.685 0.678 5 0.680 0.624 0.618 0.614 6 0.685 0.693 0.607 0.669 What would be the center line of a 3-sigma ?¯x¯ chart?
- An agronomist undertook an experiment to investigate the factors that potato harvest. In his research, agronomist decided to divide the farm into 30 half hectare plots and apply varies level of fertilizer. Potato was then planted and the harvest at the end of the season was recorded. Fertilizer(Kg) Harvest (tons) 210 43.5 220 40.0 230 48.0 240 65.0 250 80.0 260 85.0 270 95.0 280 80.0 290 97.3 Note: No excel ANOVA output allowed. Students need to show all the steps in calculations. You are required to; Find the simple regression line and interpret the coefficients. Find the coefficient of determination and interpret its value. Does the model appear to be a useful tool in predicting the potato harvest? If so, predict the harvest when 250KG of fertilizer is applied. If not explain why not.GreenLawns provides a lawn fertilizing and weed control service. The company is adding a special aeration treatment as a low-cost extra service option, which it hopes will help attract new customers. Management is planning to promote this new service in two media: radio and direct-mail advertising. A media budget of $4,000 is available for this promotional campaign. Based on past experience in promoting its other services, GreenLawns has obtained the following estimate of the relationship between sales and the amount spent on promotion in these two media: S = -2R2 − 12M2 − 9RM + 20R + 39M, Where S = total sales in thousands of dollars R = thousands of dollars spent on radio advertising M = thousands of dollars spent on direct-mail advertising GreenLawns would like to develop a promotional strategy that will lead to maximum sales subject to the restriction provided by the media budget. (a) What is the value of sales if $3,000 is spent on radio advertising and $1,000 is…Lyme disease is an inflammatory disease that results in a skin rash and flulike symptoms. It is transmitted through the bite of an infected deer tick. The following data represent the number of reported cases of Lyme disease and the number of drowning deaths for a rural county. Cases_of_Lyme_Disease Drowning_Deaths Month3 0 J2 1 F2 2 M4 1 A5 3 M15 9 J22 17 J13 5 A6 3…
- An engineer wants to know if producing metal bars using a new experimental treatment rather than the conventional treatment makes a difference in the tensile strength of the bars (the ability to resist tearing when pulled lengthwise). At α=0.10, answer parts (a) through (e). Assume the population variances are equal and the samples are random. If convenient, use technology to solve the problem. Treatment Tensile strengths (newtons per square millimeter) Experimental 449 354 450 360 433 388 400 Conventional 370 376 374 424 378 450 438 404 352 376 (a) Identify the claim and state H0 and Ha. The claim is "The new treatment ▼ makes a difference does not make a difference in the tensile strength of the bars." What are H0 and Ha? The null hypothesis, H0, is ▼ mu 1 equals mu 2μ1=μ2 mu 1 less than or equals mu 2μ1≤μ2 mu 1 greater than or equals mu 2μ1≥μ2 . The alternative hypothesis, Ha,…An engineer wants to know if producing metal bars using a new experimental treatment rather than the conventional treatment makes a difference in the tensile strength of the bars (the ability to resist tearing when pulled lengthwise). At α=0.02, answer parts (a) through (e). Assume the population variances are equal and the samples are random. If convenient, use technology to solve the problem. Treatment Tensile strengths (newtons per square millimeter) Experimental 400 413 434 409 420 377 392 Conventional 381 446 436 350 404 354 375 361 355 386 (a) Identify the claim and state H0 and Ha. The claim is "The new treatment ▼ makes a difference does not make a difference in the tensile strength of the bars." What are H0 and Ha? The null hypothesis, H0, is ▼ mu 1 equals mu 2μ1=μ2 mu 1 less than or equals mu 2μ1≤μ2 mu 1 greater than or equals mu 2μ1≥μ2 . The alternative…Aspen Plastics produces plastic bottles to customer order. The quality inspector randomly selects four bottles from the bottle machine and measures the outside diameter of the bottle neck, a critical quality dimension that determines whether the bottle cap will fit properly. The dimensions (in.) from the last six samples are Bottle Sample 1 2 3 4 1 0.592 0.612 0.598 0.623 2 0.584 0.572 0.584 0.573 3 0.596 0.622 0.618 0.586 4 0.606 0.614 0.585 0.598 5 0.582 0.586 0.608 0.611 6 0.583 0.571 0.605 0.625 LOADING... Click the icon to view the table of factors for calculating three-sigma limits for the x-chart and R-chart. Part 2 Suppose that the specification for the bottle neck diameter is 0.600±0.050 in. and the population standard deviation is 0.013 in. a. What is the process capability index? The Cpk is enter your response here. (Enter your response rounded to two…


