Use the data Test3Data.xls from a career resource center. The CRC samples recent graduates and measures how many are being paid more than 50k in their job after graduation and whether the proportion who get more than 50K s significantly different semester to semester. (Note if there are stars at the end of the data columns, delete the stars (missing values) before proceeding). O The best chart is a p-chart or an r-chart and it shows graduate pay is in control. O The best chart is an p-chart and it shows that the proportion who get paid more than 50k is in controlr O The best chart is a c-chart and it shows that graduate pay (>50k) is out of control O The best chart is a p-chart and it shows that proportion who get paid more than 50k is out of control.
Use the data Test3Data.xls from a career resource center. The CRC samples recent graduates and measures how many are being paid more than 50k in their job after graduation and whether the proportion who get more than 50K s significantly different semester to semester. (Note if there are stars at the end of the data columns, delete the stars (missing values) before proceeding). O The best chart is a p-chart or an r-chart and it shows graduate pay is in control. O The best chart is an p-chart and it shows that the proportion who get paid more than 50k is in controlr O The best chart is a c-chart and it shows that graduate pay (>50k) is out of control O The best chart is a p-chart and it shows that proportion who get paid more than 50k is out of control.

MATLAB: An Introduction with Applications
6th Edition
ISBN:9781119256830
Author:Amos Gilat
Publisher:Amos Gilat
Chapter1: Starting With Matlab
Section: Chapter Questions
Problem 1P

Related questions
Question
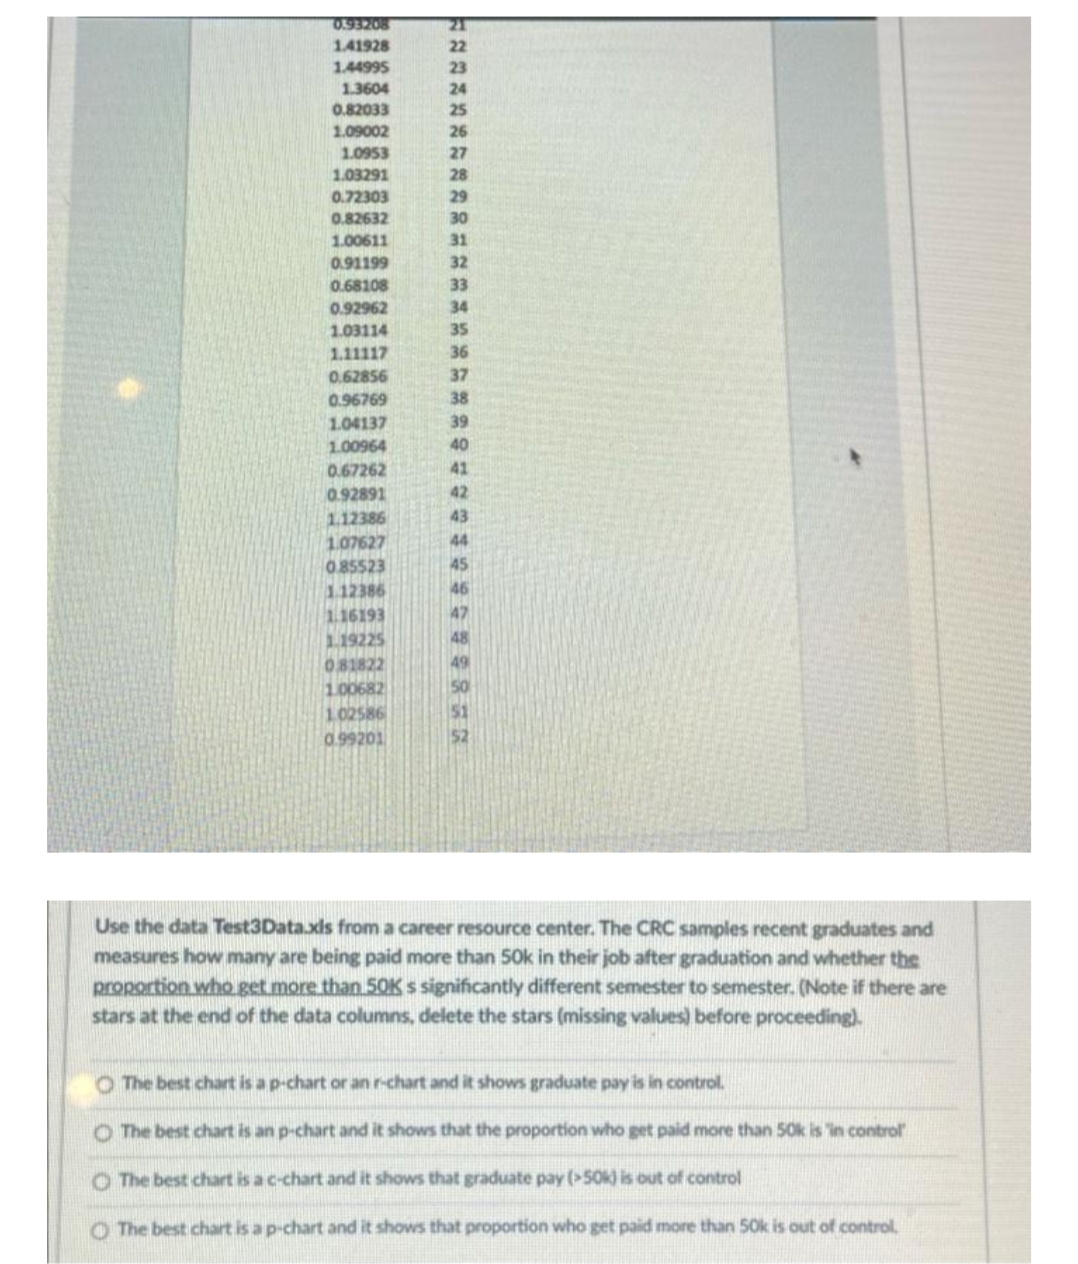
Transcribed Image Text:0.93208
21
1.41928
22
1.44995
23
1.3604
24
0.82033
25
1.09002
26
1.0953
27
1.03291
28
0.72303
29
0.82632
30
1.00611
31
0.91199
0.68108
0.92962
1.03114
32
33
34
35
1.11117
36
0.62856
37
0.96769
38
1.04137
39
1.00964
40
0.67262
41
0.92891
42
1.12386
43
44
1.07627
0.85523
45
112386
46
1.16193
47
1.19225
081822
1.00682
1.02586
0.99201
Use the data Test3Data.xls from a career resource center. The CRC samples recent graduates and
measures how many are being paid more than 50k in their job after graduation and whether the
proportion who get more than 50K s significantly different semester to semester. (Note if there are
stars at the end of the data columns, delete the stars (missing values) before proceeding).
O The best chart is a p-chart or an r-chart and it shows graduate pay is in control.
O The best chart is an p-chart and it shows that the proportion who get paid more than 50k is 'in controlr
O The best chart is a c-chart and it shows that graduate pay (>50k) is out of control
O The best chart is a p-chart and it shows that proportion who get paid more than 50k is out of control.
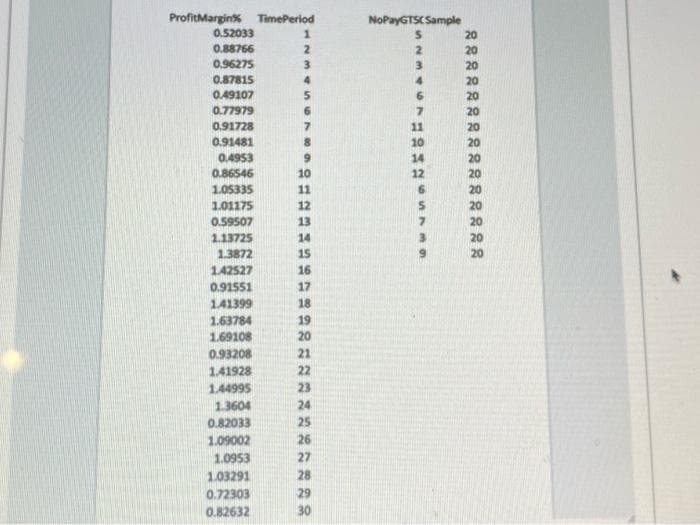
Transcribed Image Text:ProfitMargink TimePeriod
0.52033
NoPayGTSCSample
20
0.88766
0.96275
0.87815
0.49107
20
20
4.
4
20
20
0.77979
20
0.91728
11
20
0.91481
10
20
0.4953
0.86546
1.05335
14
20
10
12
20
11
20
1.01175
12
20
0.59507
13
20
1.13725
14
20
1.3872
15
20
142527
16
0.91551
17
141399
18
1.63784
1.69108
0.93208
19
20
21
1.41928
22
1.44995
23
1.3604
24
0.82033
25
1.09002
26
1.0953
27
1.03291
28
0.72303
29
0.82632
30
Expert Solution
This question has been solved!
Explore an expertly crafted, step-by-step solution for a thorough understanding of key concepts.

Step by step
Solved in 2 steps with 1 images

Recommended textbooks for you
MATLAB: An Introduction with Applications
Statistics
ISBN:
9781119256830
Author:
Amos Gilat
Publisher:
John Wiley & Sons Inc

Probability and Statistics for Engineering and th…
Statistics
ISBN:
9781305251809
Author:
Jay L. Devore
Publisher:
Cengage Learning

Statistics for The Behavioral Sciences (MindTap C…
Statistics
ISBN:
9781305504912
Author:
Frederick J Gravetter, Larry B. Wallnau
Publisher:
Cengage Learning
MATLAB: An Introduction with Applications
Statistics
ISBN:
9781119256830
Author:
Amos Gilat
Publisher:
John Wiley & Sons Inc
Probability and Statistics for Engineering and th…
Statistics
ISBN:
9781305251809
Author:
Jay L. Devore
Publisher:
Cengage Learning
Statistics for The Behavioral Sciences (MindTap C…
Statistics
ISBN:
9781305504912
Author:
Frederick J Gravetter, Larry B. Wallnau
Publisher:
Cengage Learning

Elementary Statistics: Picturing the World (7th E…
Statistics
ISBN:
9780134683416
Author:
Ron Larson, Betsy Farber
Publisher:
PEARSON

The Basic Practice of Statistics
Statistics
ISBN:
9781319042578
Author:
David S. Moore, William I. Notz, Michael A. Fligner
Publisher:
W. H. Freeman

Introduction to the Practice of Statistics
Statistics
ISBN:
9781319013387
Author:
David S. Moore, George P. McCabe, Bruce A. Craig
Publisher:
W. H. Freeman