Use the figure to the right, which shows the percentages of adults from several countries who favor building new nuclear power plants in their country. The survey indluded random samples of 1100 adults from Country A, 1012 adults from Country B, 1024 adults from Country C, and 1078 adults from Country D. At a = 0.09, can you reject the claim that the proportion of adults in Country C who favor building new nuclear power plants in their country is greater than the proportion of adults from Country D who favor building new nuclear 80- power plants in their country? Assume the random samples are independent. 100- 60- 40- 20- I Country A 49% I Country B 48% O Country C 45% O Country D 41% Identify the claim and state Ho and Ha The claim is "the proportion of adults in Country C who favor building new nuclear power plants in their country is greater than the proportion of adults from Country D who favor building new nuclear power plants in their country." Let p, represent the population proportion for Country C and p2 represent the population proportion for Country D. State Ho and H, Choose the correct answer below. O A. Ho: P1 = P2 Ha: P, P2 O B. Ho: P1 2P2 H: P, P2 Ha: P, SP2 D. Ho: P1 SP2 H,: P,> P2 Ha P, 2 P2 Find the standardized test statistic. z= 1.85 (Round to two decimal places needed.) Use technology to calculate the P-value. P-value = 0.0322 (Round to four decimal places as needed.) Naride whether to reiect or fail to reiect the null hunntheeie Chonee the corrent anewar halnw
Use the figure to the right, which shows the percentages of adults from several countries who favor building new nuclear power plants in their country. The survey indluded random samples of 1100 adults from Country A, 1012 adults from Country B, 1024 adults from Country C, and 1078 adults from Country D. At a = 0.09, can you reject the claim that the proportion of adults in Country C who favor building new nuclear power plants in their country is greater than the proportion of adults from Country D who favor building new nuclear 80- power plants in their country? Assume the random samples are independent. 100- 60- 40- 20- I Country A 49% I Country B 48% O Country C 45% O Country D 41% Identify the claim and state Ho and Ha The claim is "the proportion of adults in Country C who favor building new nuclear power plants in their country is greater than the proportion of adults from Country D who favor building new nuclear power plants in their country." Let p, represent the population proportion for Country C and p2 represent the population proportion for Country D. State Ho and H, Choose the correct answer below. O A. Ho: P1 = P2 Ha: P, P2 O B. Ho: P1 2P2 H: P, P2 Ha: P, SP2 D. Ho: P1 SP2 H,: P,> P2 Ha P, 2 P2 Find the standardized test statistic. z= 1.85 (Round to two decimal places needed.) Use technology to calculate the P-value. P-value = 0.0322 (Round to four decimal places as needed.) Naride whether to reiect or fail to reiect the null hunntheeie Chonee the corrent anewar halnw

Chapter8: Sequences, Series,and Probability
Section8.7: Probability
Problem 4ECP: Show that the probability of drawing a club at random from a standard deck of 52 playing cards is...

Related questions
Question
Decide whether to reject or fail to reject the null hypothesis. Choose the correct answer below.
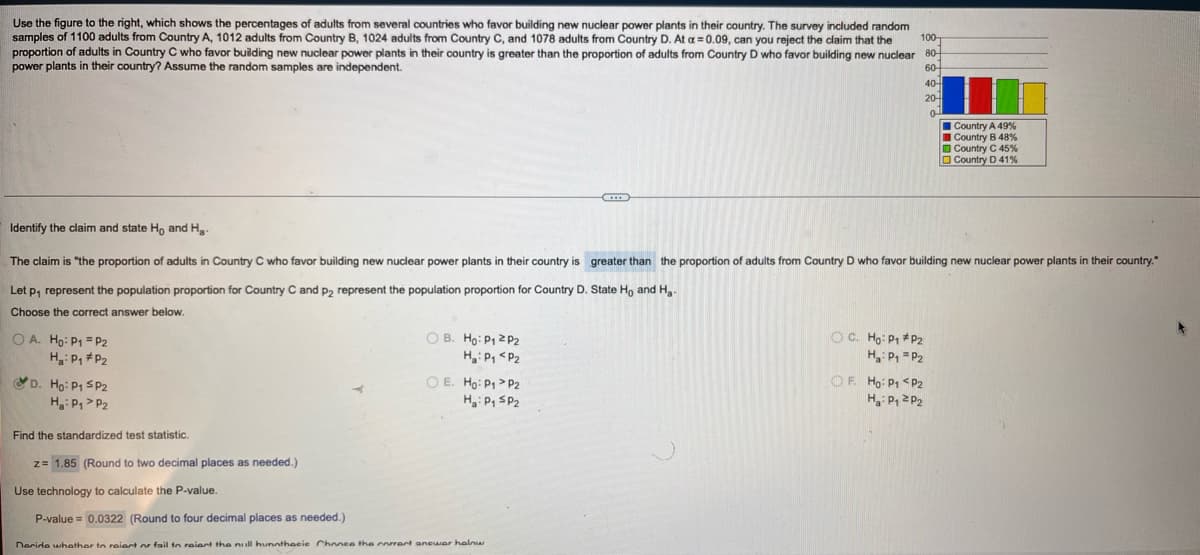
Transcribed Image Text:Use the figure to the right, which shows the percentages of adults from several countries who favor building new nuclear power plants in their country. The survey indluded random
samples of 1100 adults from Country A, 1012 adults from Country B, 1024 adults from Country C, and 1078 adults from Country D. At a = 0.09, can you reject the claim that the
proportion of adults in Country C who favor building new nuclear power plants in their country is greater than the proportion of adults from Country D who favor building new nuclear 80-
power plants in their country? Assume the random samples are independent.
100-
60-
40-
20-
I Country A 49%
I Country B 48%
O Country C 45%
O Country D 41%
Identify the claim and state Ho and H
The claim is "the proportion of adults in Country C who favor building new nuclear power plants in their country is greater than the proportion of adults from Country D who favor building new nuclear power plants in their country."
Let p, represent the population proportion for Country C and p2 represent the population proportion for Country D. State Ho and H,
Choose the correct answer below.
O A. Ho: P1 = P2
H: P, *P2
O B. Ho: P1 2 P2
H: P, <P2
OC. Ho: P1 #P2
H P, = P2
OF. Ho: P1 <P2
H: P, 2P2
D. Ho: P1 SP2
O E. Ho: P1> P2
H,: P1> P2
Ha: P, SP2
Find the standardized test statistic.
z= 1.85 (Round to two decimal places as needed.)
Use technology to calculate the P-value.
P-value = 0.0322 (Round to four decimal places as needed.)
Decide whether to reiect or fail to reiect the null hunothesis Choose the correct answer below
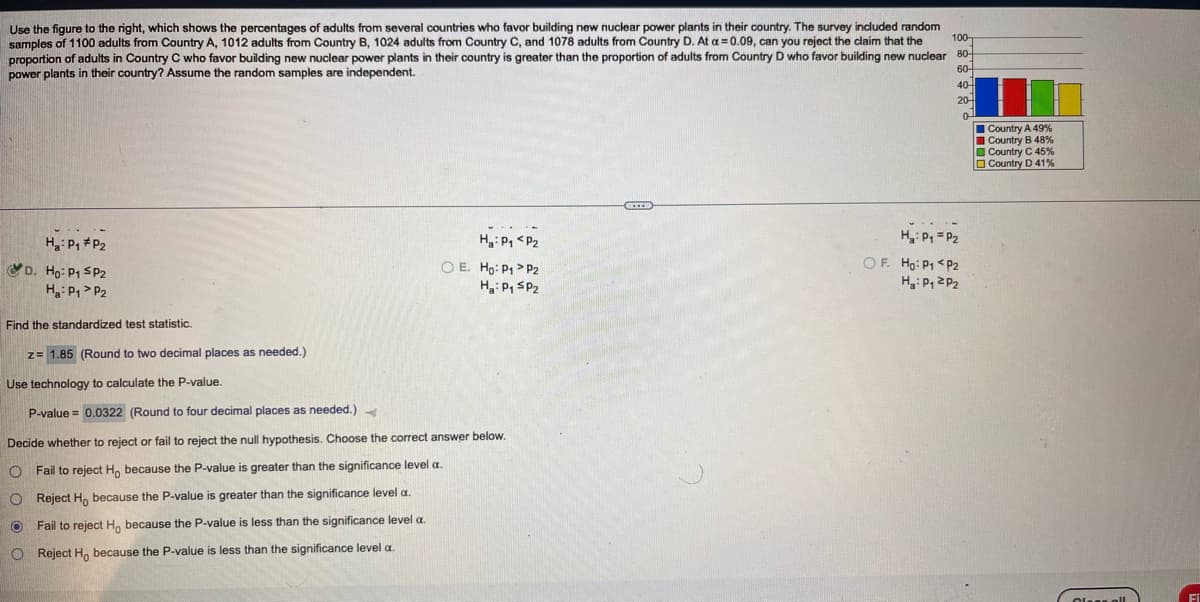
Transcribed Image Text:Use the figure to the right, which shows the percentages of adults from several countries who favor building new nuclear power plants in their country. The survey indluded random
samples of 1100 adults from Country A, 1012 adults from Country B, 1024 adults from Country C, and 1078 adults from Country D. At a = 0.09, can you reject the claim that the
proportion of adults in Country C who favor building new nuclear power plants in their country is greater than the proportion of adults from Country D who favor building new nuclear 80-
power plants in their country? Assume the random samples are independent.
100
60-
40
20-
I Country A 49%
I Country B 48%
I Country C 45%
O Country D 41%
H P, *P2
H3: P, <P2
H: P, = P2
D. Ho: P1 SP2
Hg: P1 > P2
O E. Ho: P1 > P2
H: P, SP2
OF. Ho: P1 <P2
H: P, 2P2
Find the standardized test statistic.
z= 1.85 (Round to two decimal places as needed.)
Use technology to calculate the P-value.
P-value = 0.0322 (Round to four decimal places as needed.)
Decide whether to reject or fail to reject the null hypothesis. Choose the correct answer below.
O Fail to reject H, because the P-value is greater than the significance level a.
O Reject H, because the P-value is greater than the significance level a.
O Fail to reject H, because the P-value is less than the significance level a.
O Reject H, because the P-value is less than the significance level a.
Fi
Expert Solution
This question has been solved!
Explore an expertly crafted, step-by-step solution for a thorough understanding of key concepts.

Step by step
Solved in 2 steps with 2 images

Recommended textbooks for you

Holt Mcdougal Larson Pre-algebra: Student Edition…
Algebra
ISBN:
9780547587776
Author:
HOLT MCDOUGAL
Publisher:
HOLT MCDOUGAL
Holt Mcdougal Larson Pre-algebra: Student Edition…
Algebra
ISBN:
9780547587776
Author:
HOLT MCDOUGAL
Publisher:
HOLT MCDOUGAL