Use the following ANOVA table for regression to answer the questions. Analysis of Variance Source DF SS MS F P Regression 1 3377.5 3377.5 18.1 0.000 Residual Error 174 32468.4 186.6 Total 175 35845.9 Give the F-statistic and p-value. Enter the exact answers. The F-statistic is i The p-value isi eTextbook and Media Hint P Type here to search
Use the following ANOVA table for regression to answer the questions. Analysis of Variance Source DF SS MS F P Regression 1 3377.5 3377.5 18.1 0.000 Residual Error 174 32468.4 186.6 Total 175 35845.9 Give the F-statistic and p-value. Enter the exact answers. The F-statistic is i The p-value isi eTextbook and Media Hint P Type here to search

Glencoe Algebra 1, Student Edition, 9780079039897, 0079039898, 2018
18th Edition
ISBN:9780079039897
Author:Carter
Publisher:Carter
Chapter10: Statistics
Section: Chapter Questions
Problem 22SGR

Related questions
Question
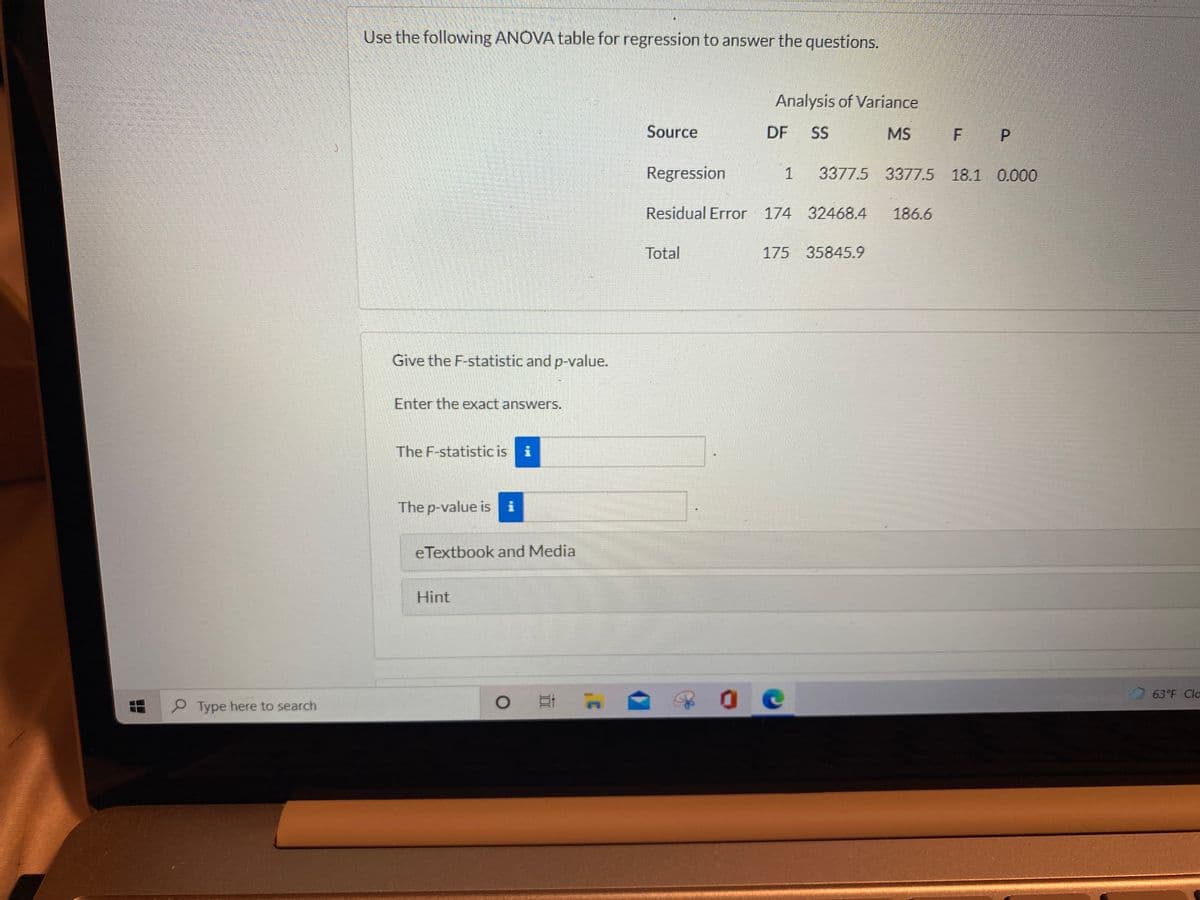
Transcribed Image Text:Use the following ANOVA table for regression to answer the questions.
Analysis of Variance
Source
DF
SS
MS
F P
Regression
3377.5 3377.5 18.1 0.000
Residual Error 174 32468.4
186.6
Total
175 35845.9
Give the F-statistic and p-value.
Enter the exact answers.
The F-statistic is i
The p-value is i
eTextbook and Media
Hint
63°F Cla
Type here to search
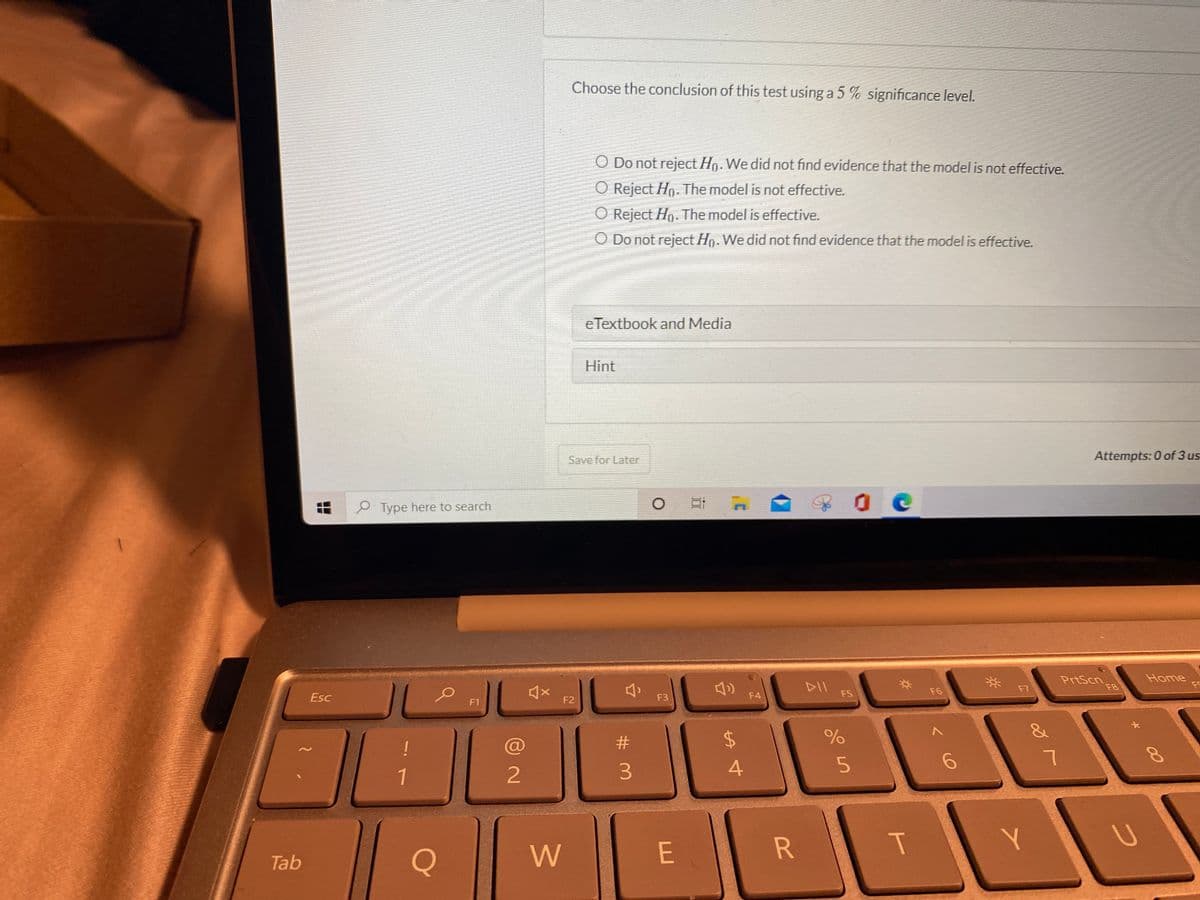
Transcribed Image Text:Choose the conclusion of this test using a 5 % significance level.
O Do not reject Ho. We did not find evidence that the model is not effective.
O Reject Hn. The model is not effective.
O Reject Ho. The model is effective.
O Do not reject Hg. We did not find evidence that the model is effective.
eTextbook and Media
Hint
Save for Later
Attempts: 0 of 3 us
O Type here to search
PrtScn
F8
Home
FS
DII
F7
FS
F6
Esc
F2
F3
F4
F1
&
!
1
3
4
E
Tab
Expert Solution
This question has been solved!
Explore an expertly crafted, step-by-step solution for a thorough understanding of key concepts.

Step by step
Solved in 2 steps with 2 images

Recommended textbooks for you
Glencoe Algebra 1, Student Edition, 9780079039897…
Algebra
ISBN:
9780079039897
Author:
Carter
Publisher:
McGraw Hill
Glencoe Algebra 1, Student Edition, 9780079039897…
Algebra
ISBN:
9780079039897
Author:
Carter
Publisher:
McGraw Hill