Use the following frequency distribution to determine the midpoint of the first class. O A. 4.5 О В. 5.0 Class Frequency ОС. 6.5 2-8 O D. 7.5 9-15 16-22 3 23-29 30-36 37-43 ....
Use the following frequency distribution to determine the midpoint of the first class. O A. 4.5 О В. 5.0 Class Frequency ОС. 6.5 2-8 O D. 7.5 9-15 16-22 3 23-29 30-36 37-43 ....

Mathematics For Machine Technology
8th Edition
ISBN:9781337798310
Author:Peterson, John.
Publisher:Peterson, John.
Chapter29: Tolerance, Clearance, And Interference
Section: Chapter Questions
Problem 16A: Spacers are manufactured to the mean dimension and tolerance shown in Figure 29-12. An inspector...

Related questions
Question
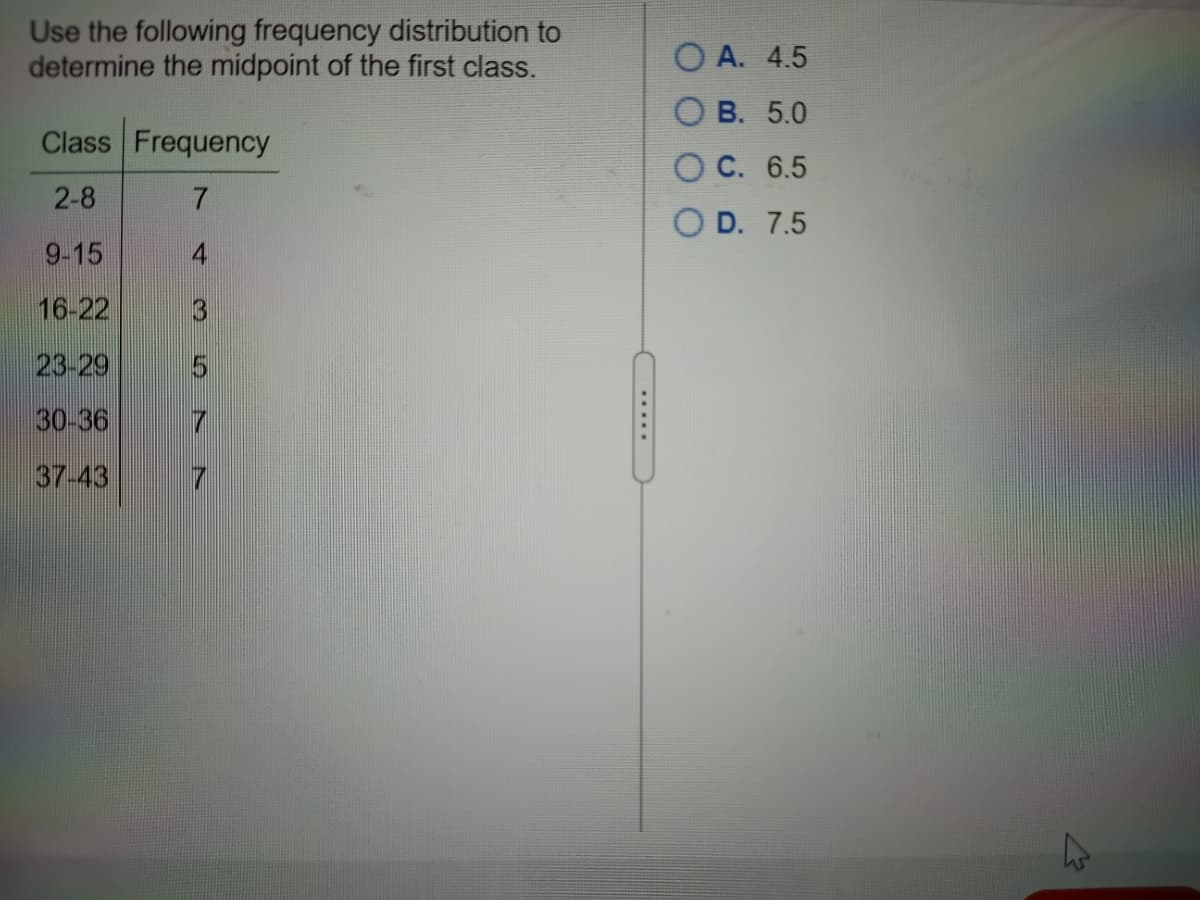
Transcribed Image Text:Use the following frequency distribution to
determine the midpoint of the first class.
O A. 4.5
O B. 5.0
Class Frequency
O C. 6.5
2-8
O D. 7.5
9-15
4
16-22
3
23-29
30-36
7
37-43
.....
Expert Solution
This question has been solved!
Explore an expertly crafted, step-by-step solution for a thorough understanding of key concepts.

Step by step
Solved in 2 steps with 2 images

Recommended textbooks for you
Mathematics For Machine Technology
Advanced Math
ISBN:
9781337798310
Author:
Peterson, John.
Publisher:
Cengage Learning,
Mathematics For Machine Technology
Advanced Math
ISBN:
9781337798310
Author:
Peterson, John.
Publisher:
Cengage Learning,