Refer to the accompanying data set and use the 30 screw lengths to construct a frequency distribution. Begin with a lower class limit of 3.470 in., and use a class width of 0.010 in. The screws were labeled as having a length of 3 1/2 in. E Click on icon to view the data. Data Table Complete the frequency distribution below. Length (in.) 3.470- Frequency Screw Lengths (inches) 3.492 3.507 3.498 3.501 3.484 3.497 3.497 3.478 3.508 3.509 3.509 3.492 3.496 3.484 3.499 3.506 3.491 3.487 3.498 3.478 3.496 3.513 3.503 3.507 3.489 3.489 3.509 3.496 3.505 3.495 (Type integers or decimals rounded to the nearest thou
Refer to the accompanying data set and use the 30 screw lengths to construct a frequency distribution. Begin with a lower class limit of 3.470 in., and use a class width of 0.010 in. The screws were labeled as having a length of 3 1/2 in. E Click on icon to view the data. Data Table Complete the frequency distribution below. Length (in.) 3.470- Frequency Screw Lengths (inches) 3.492 3.507 3.498 3.501 3.484 3.497 3.497 3.478 3.508 3.509 3.509 3.492 3.496 3.484 3.499 3.506 3.491 3.487 3.498 3.478 3.496 3.513 3.503 3.507 3.489 3.489 3.509 3.496 3.505 3.495 (Type integers or decimals rounded to the nearest thou

Big Ideas Math A Bridge To Success Algebra 1: Student Edition 2015
1st Edition
ISBN:9781680331141
Author:HOUGHTON MIFFLIN HARCOURT
Publisher:HOUGHTON MIFFLIN HARCOURT
Chapter11: Data Analysis And Displays
Section: Chapter Questions
Problem 11CR

Related questions
Question
4,12-Hi Wonderful Bartleby team,
I need help with these 2 exercises from stats, please provide an answer for all the parts. (Thanks in advance).
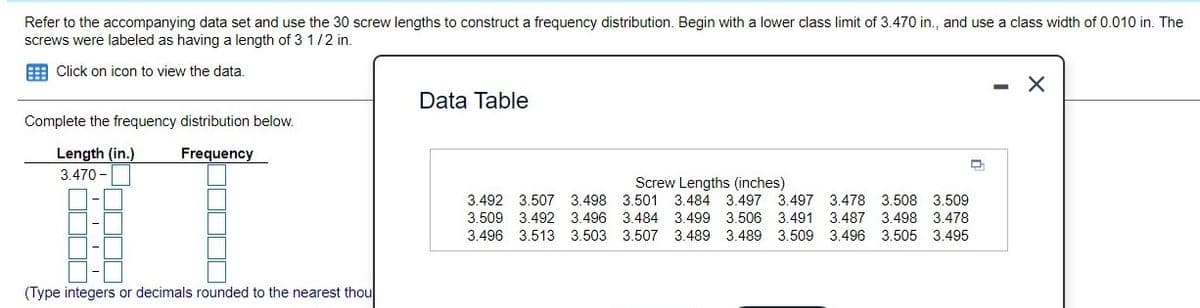
Transcribed Image Text:Refer to the accompanying data set and use the 30 screw lengths to construct a frequency distribution. Begin with a lower class limit of 3.470 in., and use a class width of .010 in. The
screws were labeled as having a length of 3 1/2 in.
E Click on icon to view the data.
Data Table
Complete the frequency distribution below.
Length (in.)
Frequency
3.470 -
Screw Lengths (inches)
3.501 3.484 3.497 3.497 3.478 3.508 3.509
3.492 3.507
3.498
3.509 3.492
3.496 3.484 3.499 3.506 3.491 3.487 3.498 3.478
3.496 3.513 3.503 3.507 3.489 3.489 3.509 3.496 3.505 3.495
(Type integers or decimals rounded to the nearest thou
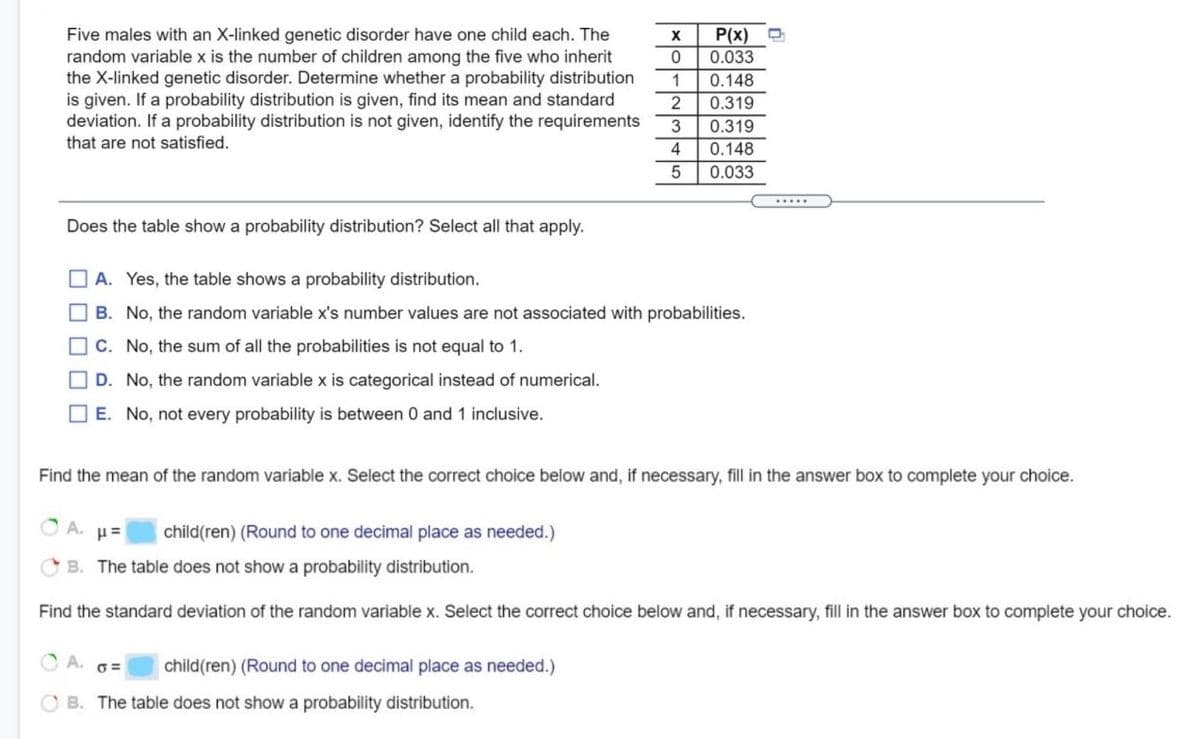
Transcribed Image Text:Five males with an X-linked genetic disorder have one child each. The
P(x)
0.033
random variable x is the number of children among the five who inherit
the X-linked genetic disorder. Determine whether a probability distribution
is given. If a probability distribution is given, find its mean and standard
deviation. If a probability distribution is not given, identify the requirements
that are not satisfied.
1
0.148
2
0.319
0.319
4
0.148
0.033
.....
Does the table show a probability distribution? Select all that apply.
O A. Yes, the table shows a probability distribution.
O B. No, the random variable x's number values are not associated with probabilities.
O c. No, the sum of all the probabilities is not equal to 1.
O D. No, the random variable x is categorical instead of numerical.
O E. No, not every probability is between 0 and 1 inclusive.
Find the mean of the random variable x. Select the correct choice below and, if necessary, fill in the answer box to complete your choice.
A.
child(ren) (Round to one decimal place as needed.)
B. The table does not show a probability distribution.
Find the standard deviation of the random variable x. Select the correct choice below and, if necessary, fill in the answer box to complete your choice.
A. 6=
child(ren) (Round to one decimal place as needed.)
O B. The table does not show a probability distribution.
Expert Solution
This question has been solved!
Explore an expertly crafted, step-by-step solution for a thorough understanding of key concepts.

This is a popular solution!

Trending now
This is a popular solution!

Step by step
Solved in 3 steps with 3 images

Recommended textbooks for you
Big Ideas Math A Bridge To Success Algebra 1: Stu…
Algebra
ISBN:
9781680331141
Author:
HOUGHTON MIFFLIN HARCOURT
Publisher:
Houghton Mifflin Harcourt

Holt Mcdougal Larson Pre-algebra: Student Edition…
Algebra
ISBN:
9780547587776
Author:
HOLT MCDOUGAL
Publisher:
HOLT MCDOUGAL

Glencoe Algebra 1, Student Edition, 9780079039897…
Algebra
ISBN:
9780079039897
Author:
Carter
Publisher:
McGraw Hill
Big Ideas Math A Bridge To Success Algebra 1: Stu…
Algebra
ISBN:
9781680331141
Author:
HOUGHTON MIFFLIN HARCOURT
Publisher:
Houghton Mifflin Harcourt
Holt Mcdougal Larson Pre-algebra: Student Edition…
Algebra
ISBN:
9780547587776
Author:
HOLT MCDOUGAL
Publisher:
HOLT MCDOUGAL
Glencoe Algebra 1, Student Edition, 9780079039897…
Algebra
ISBN:
9780079039897
Author:
Carter
Publisher:
McGraw Hill