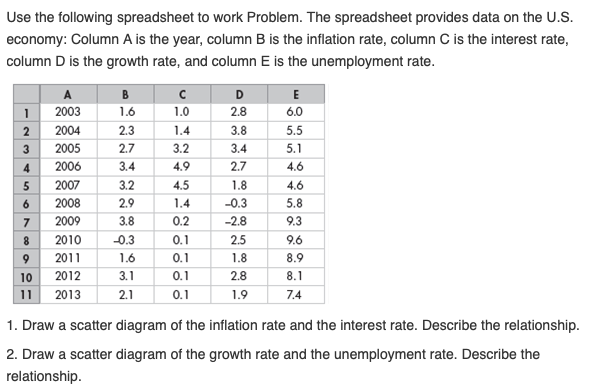
Use the following spreadsheet to work Problem. The spreadsheet provides data on the U.S. economy: Column A is the year, column B is the inflation rate, column C is the interest rate, column D is the growth rate, and column E is the unemployment rate. 1 2 3 4 5 6 7 8 9 10 11 2003 2004 2005 2006 2007 2008 2009 2010 2011 2012 2013 1.6 2.3 2.7 3.4 3.2 2.9 3.8 -0.3 1.6 3.1 2.1 с 1.0 1.4 3.2 4.9 4.5 1.4 0.2 0.1 0.1 0.1 0.1 D 2.8 3.8 3.4 2.7 1.8 -0.3 -2.8 2.5 1.8 2.8 1.9 E 6.0 5.5 5.1 4.6 4.6 5.8 9.3 9.6 8.9 8.1 7.4 1. Draw a scatter diagram of the inflation rate and the interest rate. Describe the relationship. 2. Draw a scatter diagram of the growth rate and the unemployment rate. Describe the relationship.
Use the following spreadsheet to work Problem. The spreadsheet provides data on the U.S. economy: Column A is the year, column B is the inflation rate, column C is the interest rate, column D is the growth rate, and column E is the unemployment rate. 1 2 3 4 5 6 7 8 9 10 11 2003 2004 2005 2006 2007 2008 2009 2010 2011 2012 2013 1.6 2.3 2.7 3.4 3.2 2.9 3.8 -0.3 1.6 3.1 2.1 с 1.0 1.4 3.2 4.9 4.5 1.4 0.2 0.1 0.1 0.1 0.1 D 2.8 3.8 3.4 2.7 1.8 -0.3 -2.8 2.5 1.8 2.8 1.9 E 6.0 5.5 5.1 4.6 4.6 5.8 9.3 9.6 8.9 8.1 7.4 1. Draw a scatter diagram of the inflation rate and the interest rate. Describe the relationship. 2. Draw a scatter diagram of the growth rate and the unemployment rate. Describe the relationship.

Economics (MindTap Course List)
13th Edition
ISBN:9781337617383
Author:Roger A. Arnold
Publisher:Roger A. Arnold
Chapter6: Macroeconomic Measurements, Part I: Prices And Unemployment
Section: Chapter Questions
Problem 6WNG

Related questions
Question
ANSWER QUESTION 2 ONLY PLEASE
Note:-
- Do not provide handwritten solution. Maintain accuracy and quality in your answer. Take care of plagiarism.
- Answer completely.
- You will get up vote for sure.
Transcribed Image Text:Use the following spreadsheet to work Problem. The spreadsheet provides data on the U.S.
economy: Column A is the year, column B is the inflation rate, column C is the interest rate,
column D is the growth rate, and column E is the unemployment rate.
A
2003
2004
2005
4 2006
2007
2008
2009
1
2
3
567
6
8
9
10
11
2010
2011
2012
2013
B
1.6
2.3
2.7
3.4
3.2
2.9
3.8
-0.3
1.6
3.1
2.1
с
1.0
1.4
3.2
4.9
4.5
1.4
66
0.2
0.1
0.1
0.1
0.1
D
2.8
3.8
3.4
2.7
1.8
-0.3
-2.8
2.5
1.8
2.8
1.9
E
6.0
5.5
5.1
4.6
4.6
5.8
9.3
9.6
8.9
8.1
7.4
1. Draw a scatter diagram of the inflation rate and the interest rate. Describe the relationship.
2. Draw a scatter diagram of the growth rate and the unemployment rate. Describe the
relationship.
Expert Solution
This question has been solved!
Explore an expertly crafted, step-by-step solution for a thorough understanding of key concepts.

This is a popular solution!

Trending now
This is a popular solution!

Step by step
Solved in 3 steps with 1 images

Knowledge Booster


Learn more about
Need a deep-dive on the concept behind this application? Look no further. Learn more about this topic, economics and related others by exploring similar questions and additional content below.Recommended textbooks for you
Economics (MindTap Course List)
Economics
ISBN:
9781337617383
Author:
Roger A. Arnold
Publisher:
Cengage Learning


Principles of Economics 2e
Economics
ISBN:
9781947172364
Author:
Steven A. Greenlaw; David Shapiro
Publisher:
OpenStax
Economics (MindTap Course List)
Economics
ISBN:
9781337617383
Author:
Roger A. Arnold
Publisher:
Cengage Learning
Principles of Economics 2e
Economics
ISBN:
9781947172364
Author:
Steven A. Greenlaw; David Shapiro
Publisher:
OpenStax

Exploring Economics
Economics
ISBN:
9781544336329
Author:
Robert L. Sexton
Publisher:
SAGE Publications, Inc

