Use the frequency distribution from Exercise 14 in Section 2-1 to construct a histogram. Does it appear to be the graph of data from a population with a normal distribution?
Use the frequency distribution from Exercise 14 in Section 2-1 to construct a histogram. Does it appear to be the graph of data from a population with a normal distribution?

Algebra & Trigonometry with Analytic Geometry
13th Edition
ISBN:9781133382119
Author:Swokowski
Publisher:Swokowski
Chapter10: Sequences, Series, And Probability
Section10.2: Arithmetic Sequences
Problem 53E

Related questions
Question
Use the frequency distribution from Exercise 14 in Section 2-1 to construct a histogram. Does it appear to be the graph of data from a population with a normal distribution ?
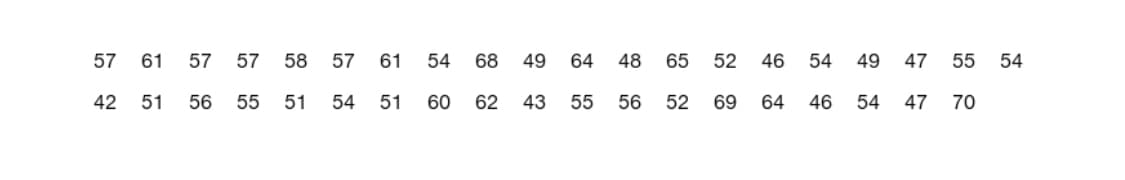
Transcribed Image Text:57 61 57 57 58 57 61 54 68 49 64 48
42 51 56 55 51 54 51 60 62
65 52 46 54 49
43 55 56 52 69 64 46 54
47 47
55 54
47 70
Expert Solution
Step 1
Histogram is a method of representation of frequency distribution of a data points.
In the x axis of a histogram, we plot class limits against we plot the frequency of each class on y axis.

Trending now
This is a popular solution!

Step by step
Solved in 2 steps with 1 images

Recommended textbooks for you
Algebra & Trigonometry with Analytic Geometry
Algebra
ISBN:
9781133382119
Author:
Swokowski
Publisher:
Cengage

College Algebra (MindTap Course List)
Algebra
ISBN:
9781305652231
Author:
R. David Gustafson, Jeff Hughes
Publisher:
Cengage Learning

Algebra & Trigonometry with Analytic Geometry
Algebra
ISBN:
9781133382119
Author:
Swokowski
Publisher:
Cengage
College Algebra (MindTap Course List)
Algebra
ISBN:
9781305652231
Author:
R. David Gustafson, Jeff Hughes
Publisher:
Cengage Learning